
You are here:
Forecast Insights Dashboard
Track changes in your sales forecast in the Forecast Insights dashboard. Monitor velocity, pipe coverage, and other KPIs with period-over-period analysis.
Required Editions
| Available in: Revenue Intelligence, which is available for an additional cost in Enterprise and Unlimited editions. |
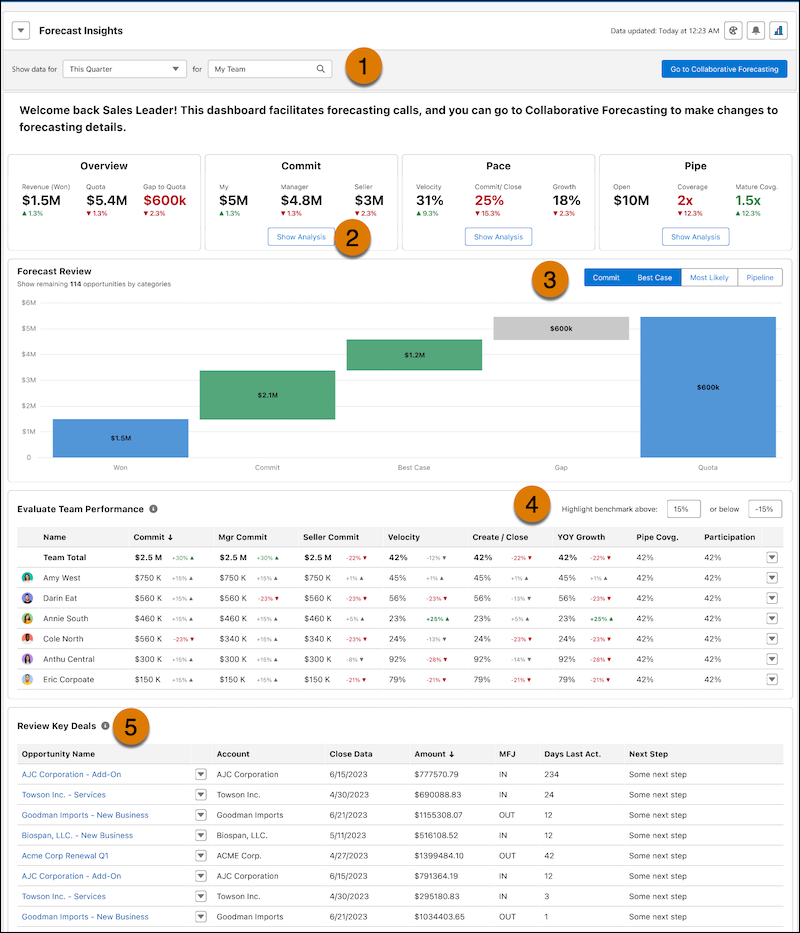
In the Forecast Insights dashboard, select the timeframe and team you want to analyze (1). You can see details for the managers and sellers that report to you. Click Show Analysis (2) to see how your metrics are trending over time. Looking across your sales, click Commit, Best Case, Most Likely or Pipeline (3) to remove that category from the pipeline and understand its overall impact. Set the benchmark values so that the high and low benchmarks display on the table (4). See the key details for your largest opportunities (5).
| KPI | CALCULATION |
|---|---|
| Attainment | % of target = (Closed Won Amt./Target quota) * 100. |
| Closed Won (Current) | Total amount of closed won opportunities for the current selected period. |
| Commit | Commit for the user's role. Shows adjustment if one is entered. |
| Commit Attainment | % of target = ((Commit Amount + Closed Won Amt.)/Target quota) * 100. |
| Commit (Manager) | Sum of commit for lowest forecast manager in the hierarchy. |
| Commit (Seller) | Sum of commit for the lowest layer in the role hierarchy. |
| Historical Velocity | % Attainment same time last year. |
| Velocity | closed won attainment % same time last year. |
| Open Pipeline | Open pipe (Current) = Pipeline + Best Case + Commit. |
| Pipeline Coverage (Current) | Pipe Coverage = (Target - Closed Won)/(Open Pipe). |
| Pipeline Coverage (Mature) | Best case and commit amount or custom amount/ (Commit adjustment-Won). |
| Quota | Quota for the current period. |
| Velocity | Closed won attainment % same time last year. |
| Year over year (Commit) | (Commit forecast Amount at the same time last year- Current Commit Forecast Amount)/(Commit forecast Amount at the same time last year) * 100. |
| Year over year (Closed won) | (Closed Won Amount at the same time last year- Current Closed Won Amount)/(Closed Won Amount at the same time last year) * 100 |
| Year over year (Open Pipeline) | (Open pipe amount at the same time last year- Current open pipe amount)/(Open pipe amount at the same time last year) * 100. |
| Year over year (Quota) | (Last year's quota - Current year's quota)/(Last year's quota) * 100. |
Did this article solve your issue?
Let us know so we can improve!