
You are here:
Revenue Insights Forecast Historical Trend Tab
If you’ve enabled historical trending on the forecast item object, you can view the new forecast historical trend chart in Revenue Insights.
With forecast historical trend, you can keep up to a year of historical data on your forecast item. The default is just over a year. Use Forecast Historical Trend to see how your current forecast compares to the same time period in previous forecasts. For example, if you have 20 days left in Q4, the chart compares your forecast to previous quarters when you had 20 days left.
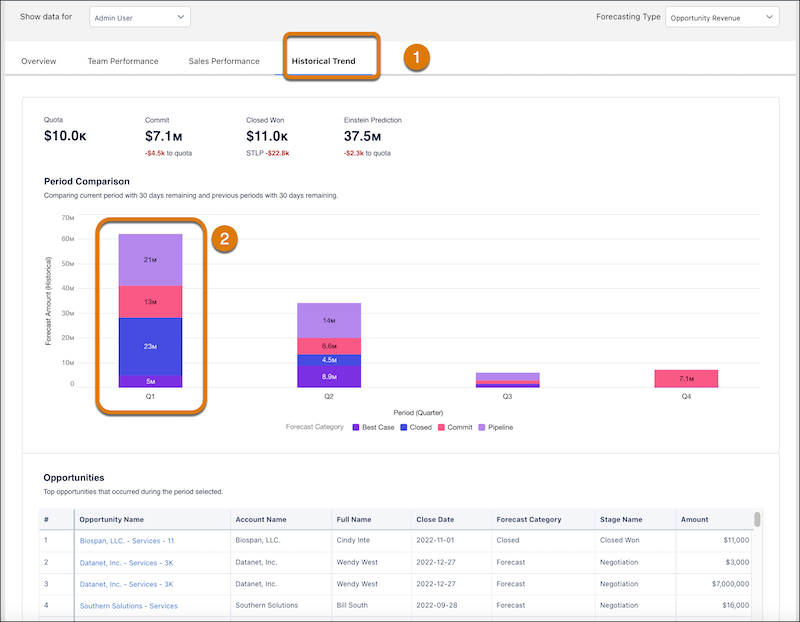
Click the Historical Trend tab to open the page (1) Click the columns to populate the opportunities table (2). If there’s no historical trending for opportunities, the table doesn’t populate.
Did this article solve your issue?
Let us know so we can improve!