
You are here:
Sales Rep Command Center Dashboard
Get all the details you need for sales success from the Sales Rep Command Center. You can see whether you’re aligned to meet your quotas, which opportunities are stuck, and overdue activities. You can also see step progression, and amount changes.
Required Editions
| Available in: Lightning Experience |
| Available with Sales and Government Cloud Plus for an additional cost in: Enterprise, Performance, and Unlimited editions |
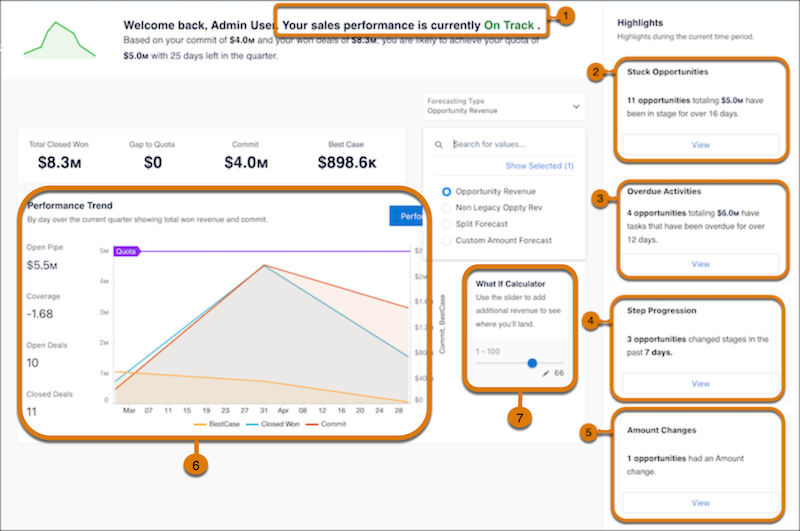
In the Sales Rep Command Center, Sales reps immediately see if they’re on track (1). You can view stuck opportunities (2), overdue activities (3), step progression (4), and amount changes (5). Choose between the Performance Trend dashboard and the Pipeline Overview dashboard (6). Use the “What If” Calculator to see how adding revenue affects the sales outcome. By default the calculator values are set 0 through 100,000 in increments of 1000, but you can adjust the values in the widget to suit your needs (7).
KPI Calculations for on and off Track Metrics
The On and Off Track chart shows the following metrics:
- Closed Won: The total amount of all Closed Won Opportunities.
- Gap to Quota: Quota minus Closed Won.
- Commit: The total amount of all Open Opportunities where the Forecast Category is equal to Commit.
- Best Case: Open Opportunities where the Forecast Category is Best Case.
KPI Calculations for Sales Stage Metrics:
The following calculations are for sales stage metrics:
- No Activity: This metric can be one of two measures. No recent activity (Open opportunities with no activity in the last fourteen days), or No upcoming activity (Open opportunities with no activities scheduled in the future from today.)
- No Next Step: Open Opportunities where the Next Step field is blank.
- Stuck in Stage: Opportunities that have been in the same stage for more than fourteen days longer than the average days in the stage.
KPI Calculations for Opportunity Changes.
The Opportunity Changes metrics are calculated in the following way:
- Amount: Open Opportunities where the Amount field has changes in the last seven days.
- Close Date: Open Opportunities where the Close Date field has changes in the last seven days.
- Forecast Category: Open Opportunities where the Forecast Category field has changes in the last seven days.
- New: Open Opportunities that have been created in the last seven days.
- Lost: Closed Lost Opportunities in the last seven days.
KPI Calculations for Top Open Opportunities
The Top Open Opportunities are calculated in the following ways:
- Commit: Open Opportunities where the Forecast Category is Commit.
- Most Likely: Open Opportunities where Forecast Category is Most Likely.
- Best case: Open Opportunities where the Forecast Category is Best Case.
- Pipeline: Pipeline:Open Opportunities where the Forecast Category is Pipeline.