
You are here:
Revenue Insights Team Tab
Quickly identify opportunities for managers to coach or representatives to work on performance. See details, such as the sales leader, average win rate, open pipeline, and activities completed. It’s easy to assess the top accounts, opportunities, and products, so you know where to focus your efforts.
Use the Charts
The Team view helps you to quickly make decisions about how to increase productivity among your team members. You can also see an overview of the top accounts, top open opportunities, and top products. You can select four metrics to view at a time.
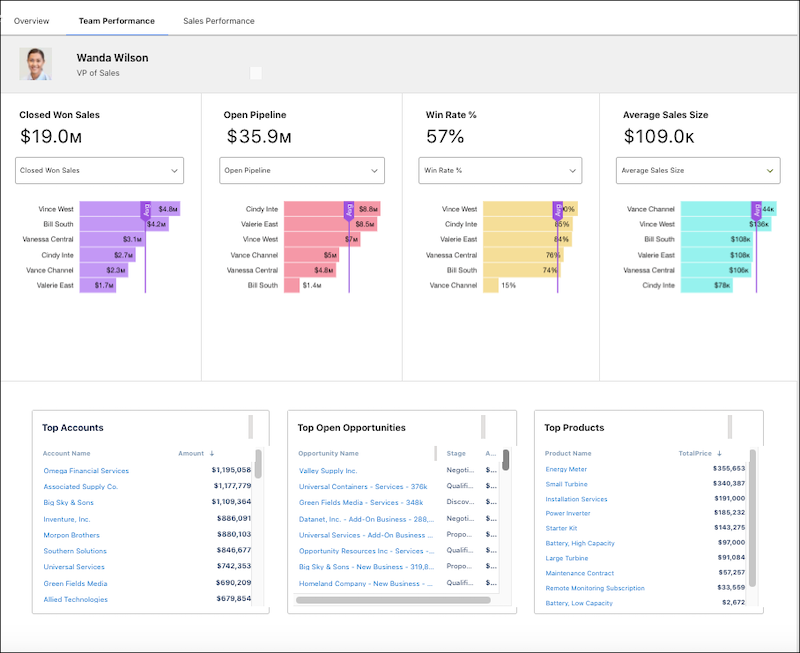
KPI Calculations
- Closed Won Sales: The total Amount of all Closed Won Opportunities.
- Quota: The quota for a given sales representative.
- Quota Attainment %: The percentage of Closed Won Sales to Quota.
- Gap to Quota: Quota minus Closed Won.
- Commit: The total amount of all Open Opportunities where the Forecast Category is equal to Commit.
- Open Pipeline: The total amount of all Open Opportunities where the Forecast Category is equal to Pipeline, Best Case, Most Likely, or Commit.
- Pipeline Coverage: Open Pipeline divided by Gap to Quota.
- Average Sales Size: The sum of all Closed Won Opportunities divided by the total number of Closed Won Opportunities.
- Average Days to Close: The sum of CloseDate minus CreatedDate for all Closed Won Opportunities divided by the total number of Closed Won Opportunities.
- Win Rate %: The percentage of Closed Won Opportunities to Closed Opportunities (won and lost).
- Closed Opportunities: The total number of Opportunities (won and lost).
- Activities Completed: The total number of Activities (Tasks and Events) where the Status is equal to Complete.
- Open Activities: The total number of Activities (Task and Events) where Status is not equal to Complete.
- Overdue Activities: The total number of Activities (Task and Events) where today is greater than the Due Date and Status is not equal to Complete.
Did this article solve your issue?
Let us know so we can improve!