Determine the best markets for expanding your business, diversify recruiting efforts
based on specific demographics, and focus your sales and service efforts among key populations.
Visual indicators on a map show where you can concentrate your search for new business
opportunities and talent using demographic data in Salesforce Maps.
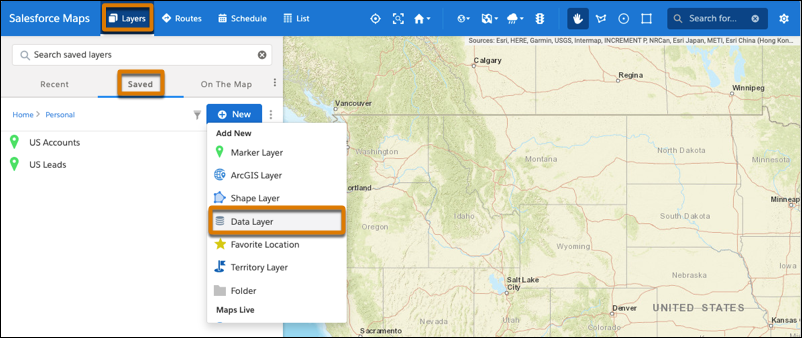
Click Layers | Saved | Personal | New | Data Layer.
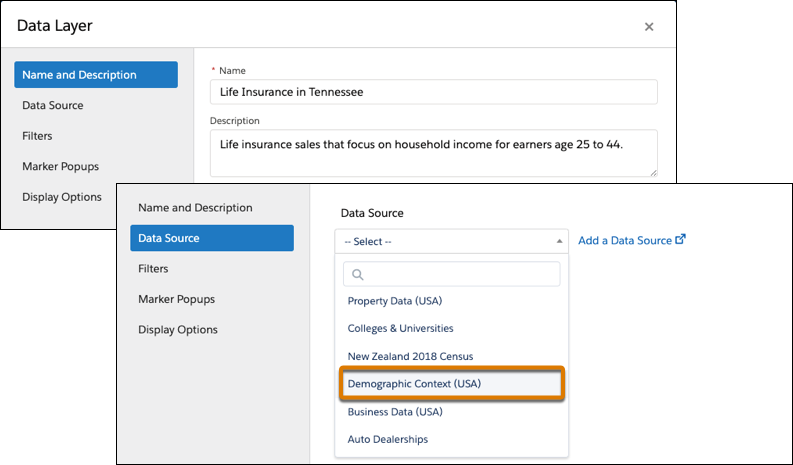
Enter a name and a description for your data layer. Select the data source
Demographic Context (USA), and then select the level of detail that you
want to appear on the map such as neighborhoods or ZIP codes.
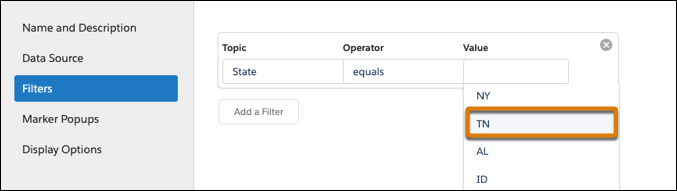
Add a filter so that you focus on a specific area such as a state or a county.
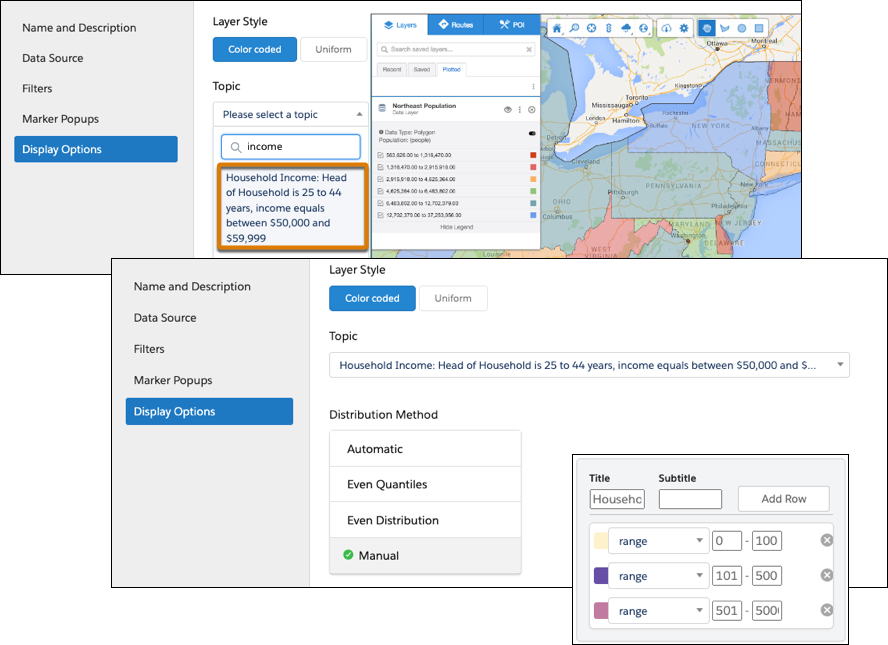
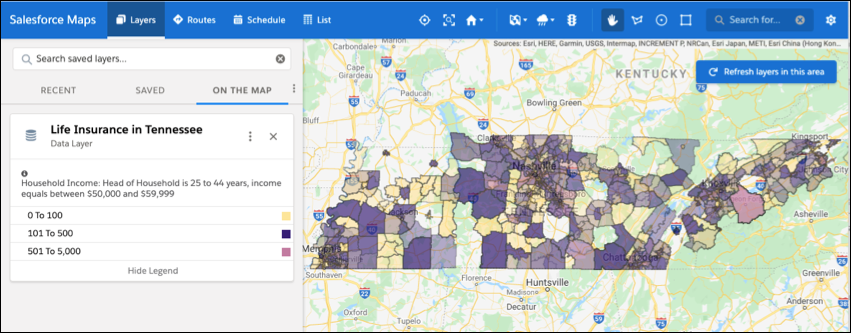
Add styles that help you differentiate areas that represent greater opportunities than
others. For example, you want to focus on ZIP codes where the most households earn between
$50,000 and $59,999. To show you where to focus your energy, you set ranges and corresponding
colors that show concentrations of households earning income based on your selection.
Save your work, and then plot the data layer. Zoom to the areas where you want to focus
your efforts.
Did this article solve your issue?
Let us know so we can improve!
Loading
Salesforce Help | Article
Cookie Consent Manager
General Information
Required Cookies
Functional Cookies
Advertising Cookies
General Information
We use three kinds of cookies on our websites: required, functional, and advertising. You can choose whether functional and advertising cookies apply. Click on the different cookie categories to find out more about each category and to change the default settings.
Privacy Statement
Required Cookies
Always Active
Required cookies are necessary for basic website functionality. Some examples include: session cookies needed to transmit the website, authentication cookies, and security cookies.
Functional Cookies
Functional cookies enhance functions, performance, and services on the website. Some examples include: cookies used to analyze site traffic, cookies used for market research, and cookies used to display advertising that is not directed to a particular individual.
Advertising Cookies
Advertising cookies track activity across websites in order to understand a viewer’s interests, and direct them specific marketing. Some examples include: cookies used for remarketing, or interest-based advertising.