
You are here:
Sales Stage Analysis Conversion
Dive into the details of your pipeline using Stage Conversion analysis. You can answer questions such as what percentage of the pipeline progressed beyond each stage in a time period. You can see what percentage of pipeline progressed to close from this stage on the same day of this last period. You can understand what is the average conversion rate for open opportunities for the selected stage.
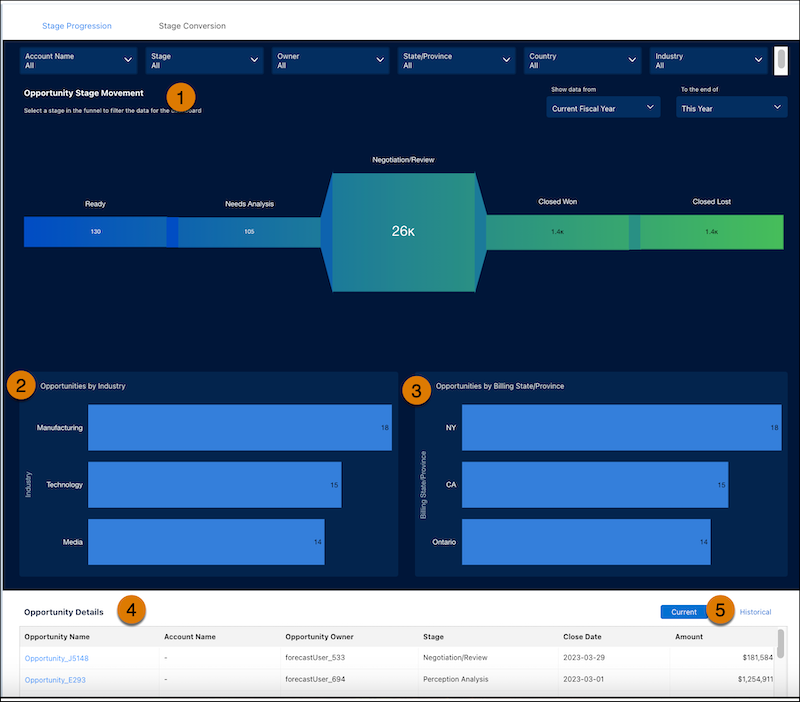
In the Sales Stage Analysis dashboard, view the details of the progression of opportunities from Discovery to Closed Won or Closed Lost (1). See how opportunities represent different industries (2) and State and Billing provinces (3). You can also see opportunity details (4) and sort by current opportunities or historical opportunities (5).
From the top of the dashboard, select from the filters to narrow the scope of the analysis:
- Account Name. Account names related to opportunities in the dashboard
- Stage. Names in the standard StageName field in the Opportunities object.
- Owner. Names of opportunity owners. It can include inactive users or users who don’t own any deals in the selected period
- State/Province. Area of the billing grouped by state or Province.
- Country. Area of the opportunity sorted by country.
- Industry. Opportunities sorted by industry.
| KPI | CALCULATION |
|---|---|
| Opportunity Stage Movement | The average conversion rate for open opportunities for the selected stage. |
| Opportunity by Industry | Opportunities within the given time frame sorted by industry. |
| Opportunity by Billing State/Province | Opportunities within the given time frame sorted by billing state or province. |
| Opportunity Details | Total closed won/Total opportunities based on the selected stage during the period set in the Historical Time Frame filter. If no stage is selected, it shows the win rate. |