
You are here:
Sales Stage Analysis Progression
Sales Stage Analysis Progression shows how deals move through stages of the sales process and if deals are moving smoothly. It also reveals bottlenecks and exposes at-risk opportunities.
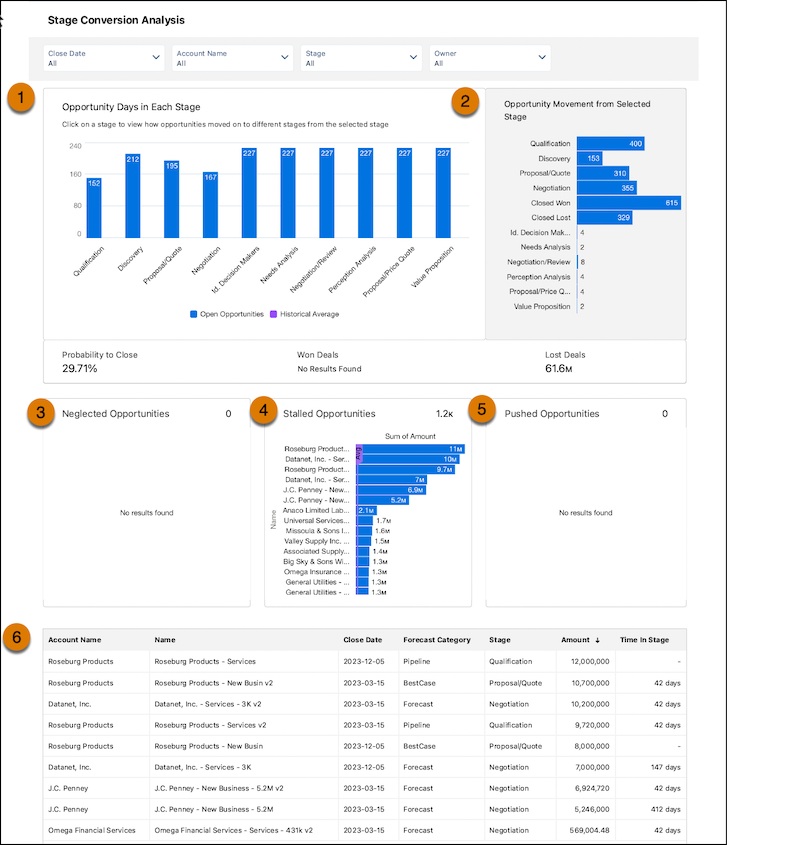
In the Sales Stage Analysis dashboard, view how long a deal was at each stage and the number of won and lost deals (1). Track opportunity movement (2) and neglected opportunities (3). You can also see which deals have been in the same stage for more than 30 days (4) and pushed opportunities (5). Lastly, take a deep dive into the different deals (6).
The Sales Stage Analysis dashboard compares how long current opportunities take in each stage of your pipeline with data on historic deals. The main chart shows the historic and current average number of days deals spend in that stage. By comparing current with historical data, the dashboard determines which deals are at risk and displays them in neglected, stalled, and pushed opportunities charts at the bottom of the dashboard.
From the top of the dashboard, select from the filters to get the details you want to see:
- Account: Account names related to opportunities in the dashboard
- Owner Name: Names of opportunity owners. It can include inactive users or users who don’t own any deals in the selected period
- Owner Role: Role name of opportunity owners.
- Stage Name: Names in the standard StageName field in the Opportunities object.
- Record Type: Opportunity record type names defined in your org.
- Close Date: Opportunity closed date based on Salesforce fiscal year settings.
- Historical Time Frame: Period used to calculate the average time in stage.
| KPI | CALCULATION |
|---|---|
| Historical Average | Number of days each opportunity stay in each stage. Average days in stage for all opportunities in the OpportunityHistory object, based on the period set in the Historical Time Frame filter. |
| Open Opportunities | Number of days current open opportunities stay in each stage. Average days in stage to date for all open opportunities with close dates within the period selected in the Close Date filter. |
| Opportunity Days in Each Stage | Shows the number of opportunities moved from the stage selected in the main chart to other stages based on period set in the Historical Time Frame filter. |
| Probability to close | Total closed won/Total opportunities based on the selected stage during the period set in the Historical Time Frame filter. If no stage is selected, it shows the win rate. |
| Won Deals | Total amount won during the period set in the Historical Time Frame filter. |
| Lost Deals | Total amount won during the period set in the Historical Time Frame filter. |
| Neglected Opportunities | Top open opportunities by amount that haven’t been touched in 60 days that are set to close in the selected period. |
| Stalled Opportunities | Top open opportunities by amount that have stayed in current stage at least one day longer than historical average for all opportunities. Based on the close date in the selected period. |
| Pushed Opportunities | Top open opportunities by push count based on the close date in the selected period. |