
You are here:
Track Einstein Classification App Performance
The performance dashboard shows you how well Einstein’s predictions are working. View the performance of predictions compared to the field value at the time the case is closed. For Case Classification and Case Wrap-Up, you can use this information to help determine automation levels.
Required Editions
| View supported editions. |
| User Permissions Needed | |
|---|---|
| To build and manage Einstein Case Classification and Einstein Case Wrap-Up: | View Setup AND Customize Application AND Manage Profiles and Permission Sets AND Edit on cases OR Modify All Data |
- From Setup, enter Einstein Classification in the Quick Find box, and then select Einstein Classification.
- From the models list, click a model’s name.
-
On the Overview tab, select the field of interest and the date range to display
performance information for closed cases.
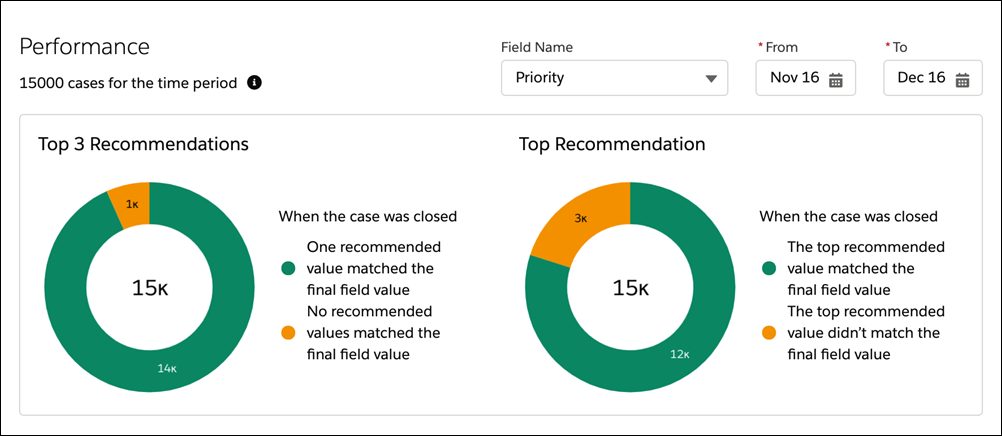
Top 3 Recommendations shows how often one of the top three recommended values matches the final field value when the case is closed. Top Recommendation shows how often the top recommended value matches the final field value when the case is closed. When a case with field predictions is closed, the dashboard refreshes.
The dashboard shows the total number of closed cases on which Einstein predicted field values, regardless of whether predictions were rejected, accepted, ignored or automatically saved. This number increases by one when a case with predictions is closed. If a closed case with predictions is reopened and then closed, both closures count.
Closed cases that didn’t receive recommendations aren’t counted.
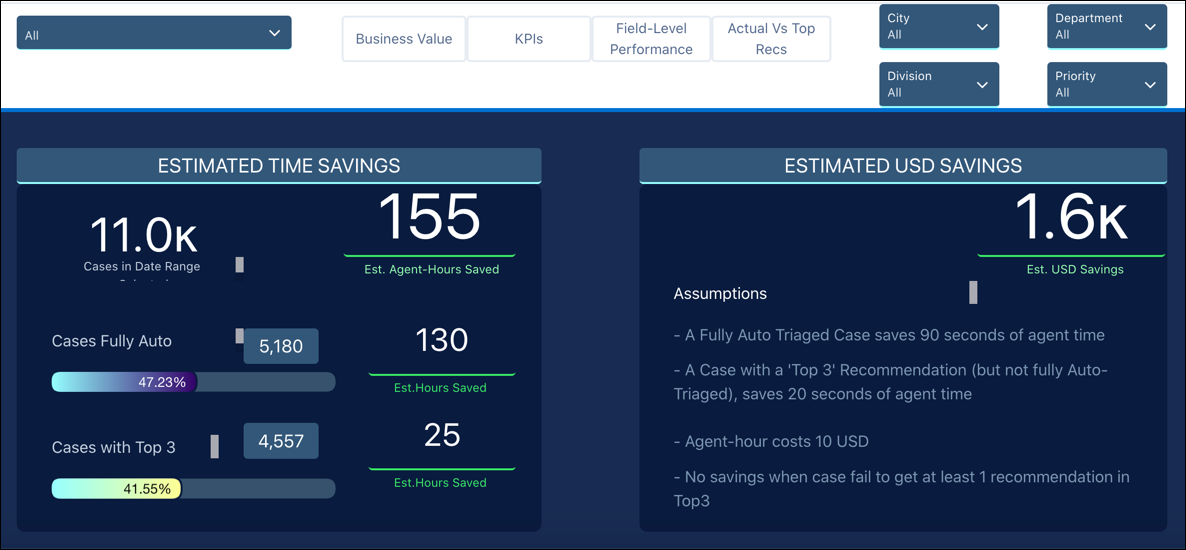
The dashboard uses your case data and classification performance metrics to show the accuracy of recommendations surfaced by Einstein Case Classification and track how Einstein Case Classification impacts Average Handle Time for your cases. Learn More
- For Einstein Case Classification, review cases whose field predictions failed to meet the required confidence level for automatic updates. Use platform events to subscribe to AIUpdateRecordEvent so you’re notified any time Einstein tries to predict the value of a case field. The IsUpdated field indicates whether a field was automatically updated. Then, use this information to add cases to a queue for review or rerun case routing logic.
- Generate custom reports about how many cases received predictions or how often service reps
accepted or rejected them. Use the root AIRecordInsight object and its related child
objects, AIInsightFeedback and AIInsightValue.
 Note AIRecordInsight and its child objects provide different information than the dashboard. Reports with these objects can show service rep reactions to recommendations. For example, you can build reports to show how often service reps acted on the top three predictions and whether a recommended value was applied and saved.
 - Use key performance indicators (KPIs) to assess the impact of Einstein classification
apps. For example, review changes in:
- Average handle-time to triage a case
- Average time to resolve a case
- Number of cases triaged per day, week, or month
- Number of cases auto-triaged per day, week, or month
- Number of reopened cases
- Number of escalated cases
- Case data completion