
You are here:
View Field Service Resource Utilization
To make smarter scheduling and hiring decisions, view your service resources’ individual utilization percentages. You can see each resource’s utilization percentage for a particular day or over multiple days, and sort resources in the Gantt by utilization.
Required Editions
| Available in: both Salesforce Classic (not available in all orgs) and Lightning Experience |
| The Agentforce Field Service and Operations core features, managed package, and mobile app are available in Enterprise, Unlimited, and Developer Editions. |
 This is a Field Service managed package feature.
A service resource’s utilization is calculated by comparing their total operating hours to the number of hours they’re scheduled to work. Utilization is calculated only for non-capacity-based service resources.
Calculate Utilization
To determine which factors are considered when calculating a resource’s utilization, click the Gantt filter icon and click the Utilization tab. Deselect factors that you don’t want to be used in the calculation.
When all factors are selected, utilization is calculated using the following equation: (Service Appointments + Absences + Breaks + Travel Time) / (Overtime Hours + *Normal Hours*)
- SA = Scheduled service appointments
- Absences = Resource absences of type Absence
- Breaks = Resource absences of type Break
- Overtime Hours = Time slots of type Extended in the resource’s operating hours for its primary service territory
- Normal Hours = Time slots of type Normal in the resource’s operating hours for its primary service territory
For example, if a resource’s operating hours add up to 20 hours per week and they’re scheduled to work 10 hours in a particular week, their average utilization for the week is 50%.
When you’re not using Enhanced Scheduling and Optimization, the resource utilization calculation for multiday service appointments factors in the duration of the appointment that’s scheduled for each day. When you’re using Enhanced Scheduling and Optimization, the calculation ignores multiday service appointments altogether.
View Utilization on the Gantt
The Gantt provides a bird’s-eye view of your team’s utilization percentages. To turn on the utilization view, select Utilization in the Gantt resolution field in the top-right corner.
From the utilization resource view, you can:
- View each resource’s average utilization over the days in the utilization view
- View a resource’s utilization for a particular day
- Click an event name to view its details
- Flag service appointments
- Click the date on the vertical axis to switch to the date’s daily view
Here’s how to customize the utilization display settings.
- Change the number of days in the utilization view
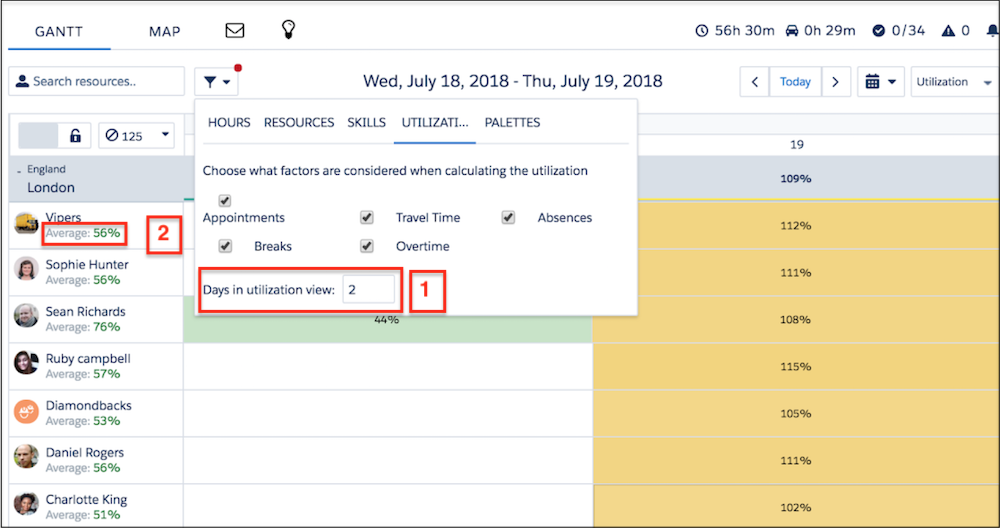
- The utilization view can show 1–31 days. To switch from the default of 31 days, click the Gantt filter icon, then click Utilization and enter your preferred number of days (1). Each resource’s Average Utilization (2), shown beneath their name in the resource list, is an average of their daily utilization percentage across the days shown in the utilization view.
- Sort the resource list by average utilization
- Sorting resources by their average utilization helps you identify which resources need more or fewer appointments. Click the Gantt filter icon, then click Resources. In the Sort by field, select Average Utilization.
- Customize the utilization-based color code
- Resources in the resource list are shown in green, yellow, or red depending on their
utilization percentage. To define the limits for these three colors, from the App Launcher,
find and open the Field Service Admin app. Click Field Service Settings | Dispatcher Console UI | Gantt Configurations. Under Utilization Views, enter the number of hours that
indicate High Utilization (default: 150), Medium Utilization (default: 100), and Extensive
Travel (default: 33). In the utilization view:
- Resources whose schedules are below Medium Utilization appear in green.
- Resources whose schedules are between High and Medium Utilization appear in yellow.
- Resources whose schedules are above High Utilization appear in red.
- Resources whose percentage of travel is larger than the value you specify are considered Extensive Travel candidates, and appear with an automobile icon.
- Show each territory’s average daily utilization
- Control when utilization information is shown for territories on the Gantt. From the App Launcher, find and open the Field Service Admin app, and then click Field Service Settings | Dispatcher Console UI | Gantt Configurations. Select Show utilization on the Gantt to show each territory's average daily utilization on the Gantt for all Gantt resolutions. If this option isn't selected, utilization information is shown only when the Gantt resolution is set to Utilization.
If a service resource is capacity-based with a defined capacity, their utilization percentage isn’t shown in the Gantt. However, their row in the Gantt displays an icon that shows how close they’re to reaching their capacity.