
You are here:
Service Intelligence Knowledge Articles Dashboard
Get a comprehensive view of your service team’s knowledge articles. Use this dashboard to understand the articles used to support case resolution, understand the ROI of knowledge articles, and improve the effectiveness of knowledge articles.
Required Editions
| View supported editions. |
In the Knowledge Performance dashboard, you can see the impact of knowledge articles by clicking the Knowledge Effectiveness tab. This tab allows you to see how knowledge articles are used over time, and understand how knowledge articles impact case resolution times.
Use filters to sort by article name, type, usage over time, publication date, and so on. Then, view the high-level statistics, such as the total article views, cases closed with a knowledge article, and case attachment rate. In the charts, you can see engagements and attachments trended over time, cases with attachments trended over time, and lastly time to handle cases. This last chart helps you understand the ROI of knowledge articles compared to cases solved without knowledge articles. Lastly, you can see knowledge article usage sorted by different user types. For details, you can drill down on a specific article.
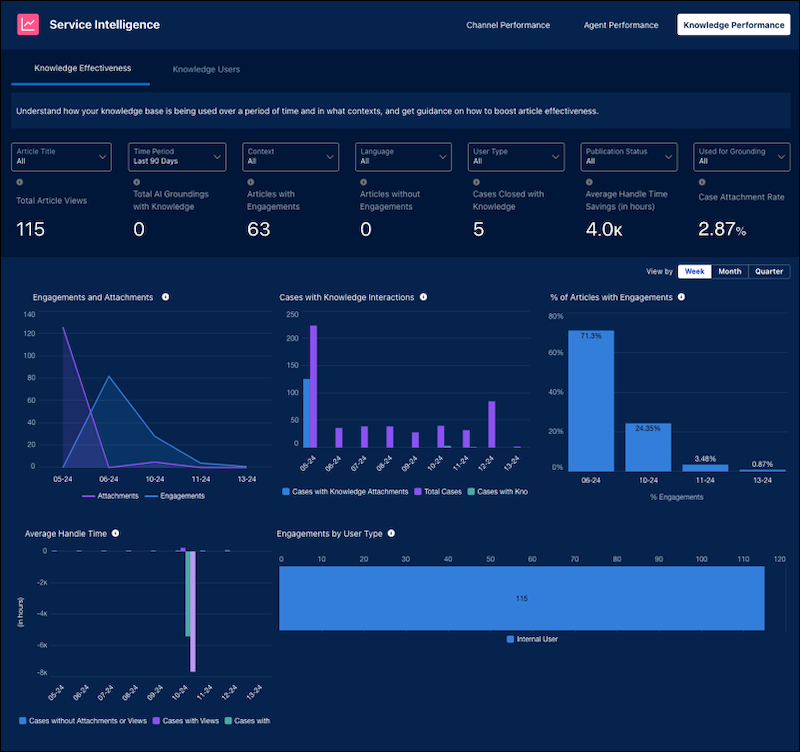
| Knowledge Effectiveness KPI | CALCULATION |
|---|---|
| Total Knowledge views | The amount of knowledge content that has been viewed. |
| Total AI groundings with Knowledge. | The amount of knowledge content used to ground generative AI output. |
| Knowledge with engagements | The amount of knowledge content that has been engaged with. |
| Knowledge without engagements | The amount of knowledge content that hasn't been engaged with. |
| Cases closed with Knowledge | The number of cases with attached knowledge content that were resolved. |
| Case attachment rate | The percentage of cases with knowledge content attached. |
| Average handle time savings | The amount of time saved to close a case because of Knowledge. |
| Engagements and attaches | Knowledge content used for AI grounding, viewed by a support rep or customer, or attached to a case. |
| Cases with Knowledge interactions | Cases with attached knowledge content or knowledge engagements, where engagements are defined as AI grounding and views. |
| Average handle times | Average handle times of cases depending on whether knowledge content was attached or viewed. |
| Engagements by user type | Number of engagements with Knowledge over time segmented by the type of user who engaged with it. |
| Engagements by data category | Number of engagements with Knowledge segmented by data category. |
In the Knowledge users tab, you can understand better which users are most engaged with knowledge articles and how effectively they engage. You can filter by user, user type, country, and company to better understand your users’ usage. You can then dive into the details of your users, such as their number of total views, and their number of recent views. Dive even further into a user’s details by reviewing how their cases were handled.
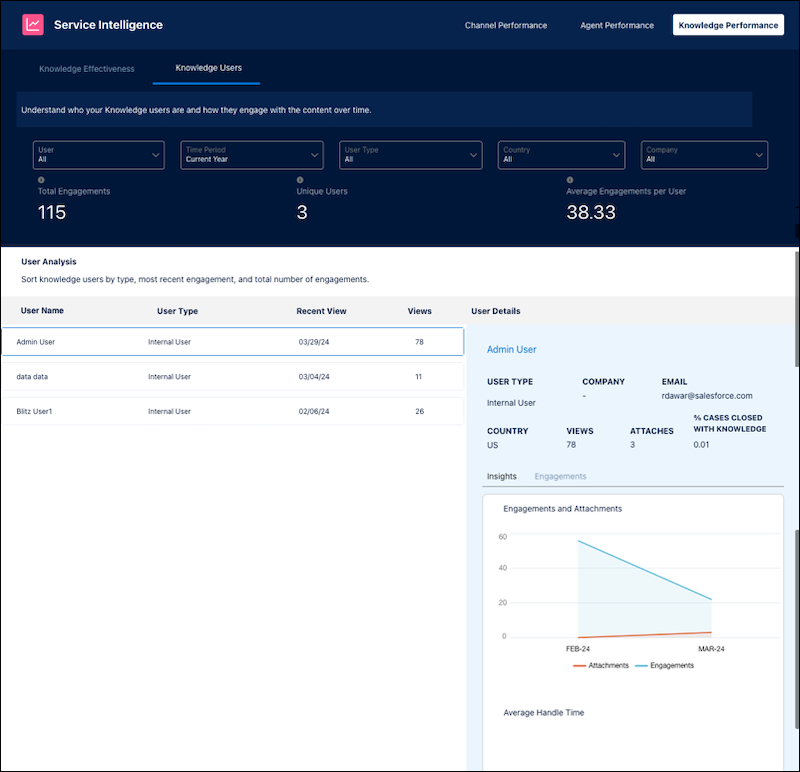
| Knowledge Users KPI | CALCULATION |
|---|---|
| Total engagements | The number of total engagements, where engagements are defined as AI grounding and views. |
| Unique users | The number of unique users for all Knowledge engagements. |
| Average engagements per user | The average number of Knowledge engagements per user. |