
You are here:
Sales Analytics Sales Overview Home (Embedded)
Designed to be embedded in the Lightning Home page, the dashboard lets sales reps see their KPIs the second they log into Salesforce. They can also quickly access the Sales Analytics dashboards that matter most to them.
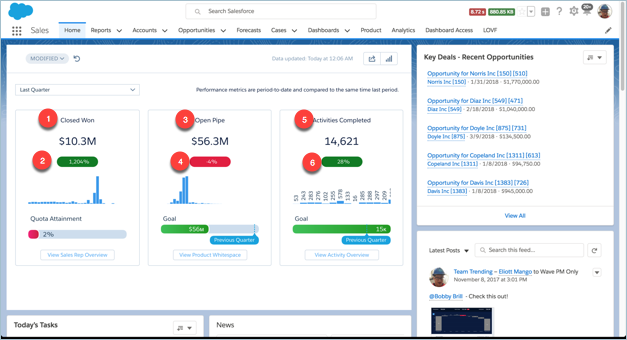
Default Behavior and Recommended Options
Embed the dashboard in the Lightning Home page using the Lightning App Builder without using any filter syntax. By default, data is filtered to show data for the rep viewing the dashboard. You see only opportunities and activities that you own.
Edit the dashboard to set target lines and the upper bounds for gauges. With the dashboard
open in Analytics Studio, click the edit icon  to open the
designer, then click the widget you want to edit. Look for the value you want to change in
the properties panel on the right and change it there. When you’re done, save the
dashboard.
to open the
designer, then click the widget you want to edit. Look for the value you want to change in
the properties panel on the right and change it there. When you’re done, save the
dashboard.
Click View Sales Rep Overview, View Product Whitespace, and View Activity Overview to open other dashboards.
Wizard and Other Setup Options
The View Product Whitespace button appears and links to the Whitespace dashboard only if you select Products on the wizard page that lets you choose to add objects. Otherwise, you see a View Pipeline Trending button, which links to the Trending dashboard.
Datasets Used
- Opportunities
- Opportunity Splits (if you add Opportunity Splits to the app on the wizard page that lets you add objects)
- Pipeline Trending
- Activities
KPI Calculations
- Closed Won (1). Total amount closed won opportunities in the selected period.
- Closed Won comparison (2). (Total amount closed won opportunities in the selected period - Total closed won opportunities in the previous period) / Total closed won opportunities in the previous period.
- Open Pipe (3). Total number of open opportunities with close dates within the selected period.
- Open Pipe comparison (4). (Total open pipe in the selected period - Total open pipe in the previous period) / Total open pipe in the previous period. The amount of open pipe in the previous period is based on data from the same day of the previous period. For example, if the period is this month, the amount is for the same day for the previous period minus 1 month.
- Activities Completed (5). Total number of activities completed in the selected period.
- Activities Completed comparison (6). (Total number of activities completed in the selected period - Total number of activities completed in the previous period) / Total number of activities completed in the previous period.
