
You are here:
Build a Smarter Pipeline with Einstein Forecasting
Take the guesswork out of forecasting. Einstein Forecasting uses AI technology to bring more certainty and visibility to your forecasts. Improve forecasting accuracy, get forecast predictions, and track how sales teams are doing.
Required Editions
| Available in: Lightning Experience and Salesforce Classic |
| Available with Sales Cloud Einstein, which is available in Performance and Unlimited Editions, and for an extra cost in Enterprise Edition |
| What’s Available | Lightning Experience | Salesforce Classic | CRM Analytics Mobile App |
|---|---|---|---|
| Prediction column |

|
|
|
| Prediction details |
|
|
|
| Prediction trend graph |
|
||
| Prediction summary graph |
|
|
Einstein Predictions
When Einstein Forecasting is enabled, the summary on the forecasts page shows the Einstein prediction column. The values in this column are the median predicted amounts for each manager’s team. Predictions are based on opportunities within the Best Case and Commit forecast categories.
- Sometimes a prediction isn’t shown, such as when sufficient historical data isn’t available or the prediction range is too large to be useful.
- Predictions are always in US dollars, unless you use multiple currencies. In that case, the amounts are converted to the currency selected by the user, using the static conversion rate set by the Salesforce admin.
Select a value in the prediction column to show more details about the prediction.
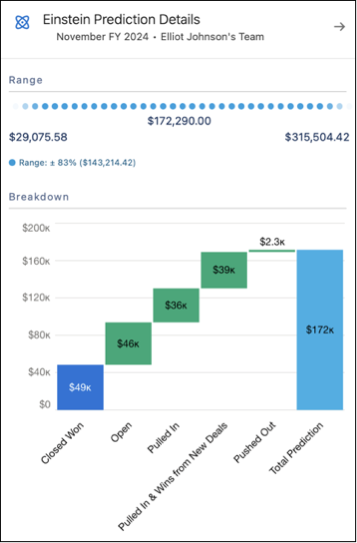
The details panel gives you a comprehensive overview of the prediction.
- Range—The full range of the prediction value, which is used to calculate the median value in the prediction column.
- Breakdown—A closer look at how Einstein came up with the prediction. These values include:
- Wins from Existing Deals: Opportunities that are predicted to close during the current forecasting period.
- Wins from New Deals: Recently created opportunities that are predicted to close during the current forecasting period.
- Pulled In: Opportunities that originally had close dates during a later forecasting period but are “pulled in” and predicted to close during the current forecasting period.
- Top Factors—Details about what contributed to the prediction. For example, perhaps your team closed more deals in a particular month compared to the past month. Or your team has more open deals in the pipeline, increasing the likelihood of closing more deals.
Weekly Changes Chart for the Current Period
From the forecasts page, switch from grid view to chart view to see a visualization of your own predicted closing within the current forecast period. The key performance indicators give you an overall sense of how you’re doing and how your numbers compare with Einstein’s predictions.
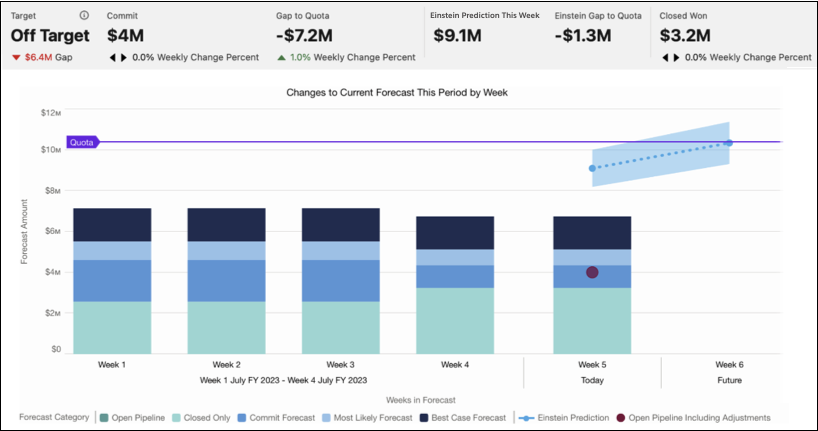
The Einstein Prediction This Week metric shows the forecasted value that Einstein predicts will be Closed Won by the end of the current week. The dotted projection line in the chart indicates the forecasted value that Einstein predicts will be Closed Won from this week through to the end of the forecast period. The predicted value at the end of the forecast period is also shown in the Einstein Prediction column for the forecast period in the forecast grid view.