
You are here:
Fundraising Performance Insights Dashboard in Nonprofit
Use the Fundraising Performance Insights dashboard to get a comprehensive overview of your fundraising campaigns. Analyze key performance metrics to evaluate the effectiveness of your initiatives based on generated revenue, donor counts, and return on investment. Focus on identifying trends and areas for improvement in your campaigns to enhance overall performance.
| REQUIRED EDITIONS |
|---|
| Available in: Lightning Experience |
| Available with: Nonprofit Cloud or Nonprofit Cloud for Grantmaking in Enterprise and Unlimited Editions |
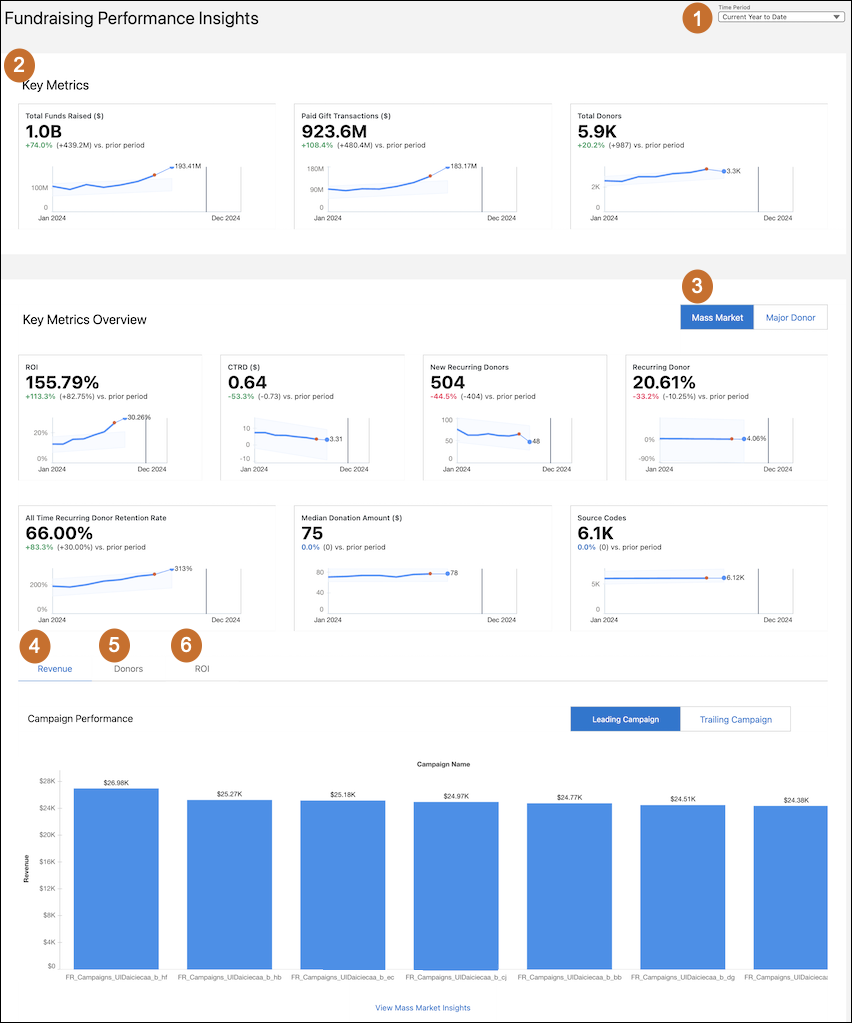
- Select the time period (1) that you want to see key metrics and analytics for.
- Review the key metrics (2) for the selected time period.
- Select Mass Market (3) to view the overall performance of your fundraising campaigns based on these metrics.
- Use the Revenue tab (4) to analyze each campaign's performance based on revenue, and view both the leading and trailing campaigns in terms of revenue generated.
- Use the Donors tab (5) to view the number of donors for each fundraising campaign, and insights into the campaigns that are performing well and the ones that need improvement.
- Use the ROI tab (6) to assess each campaign's performance based on return on investment, and identify campaigns with the highest and lowest ROI.
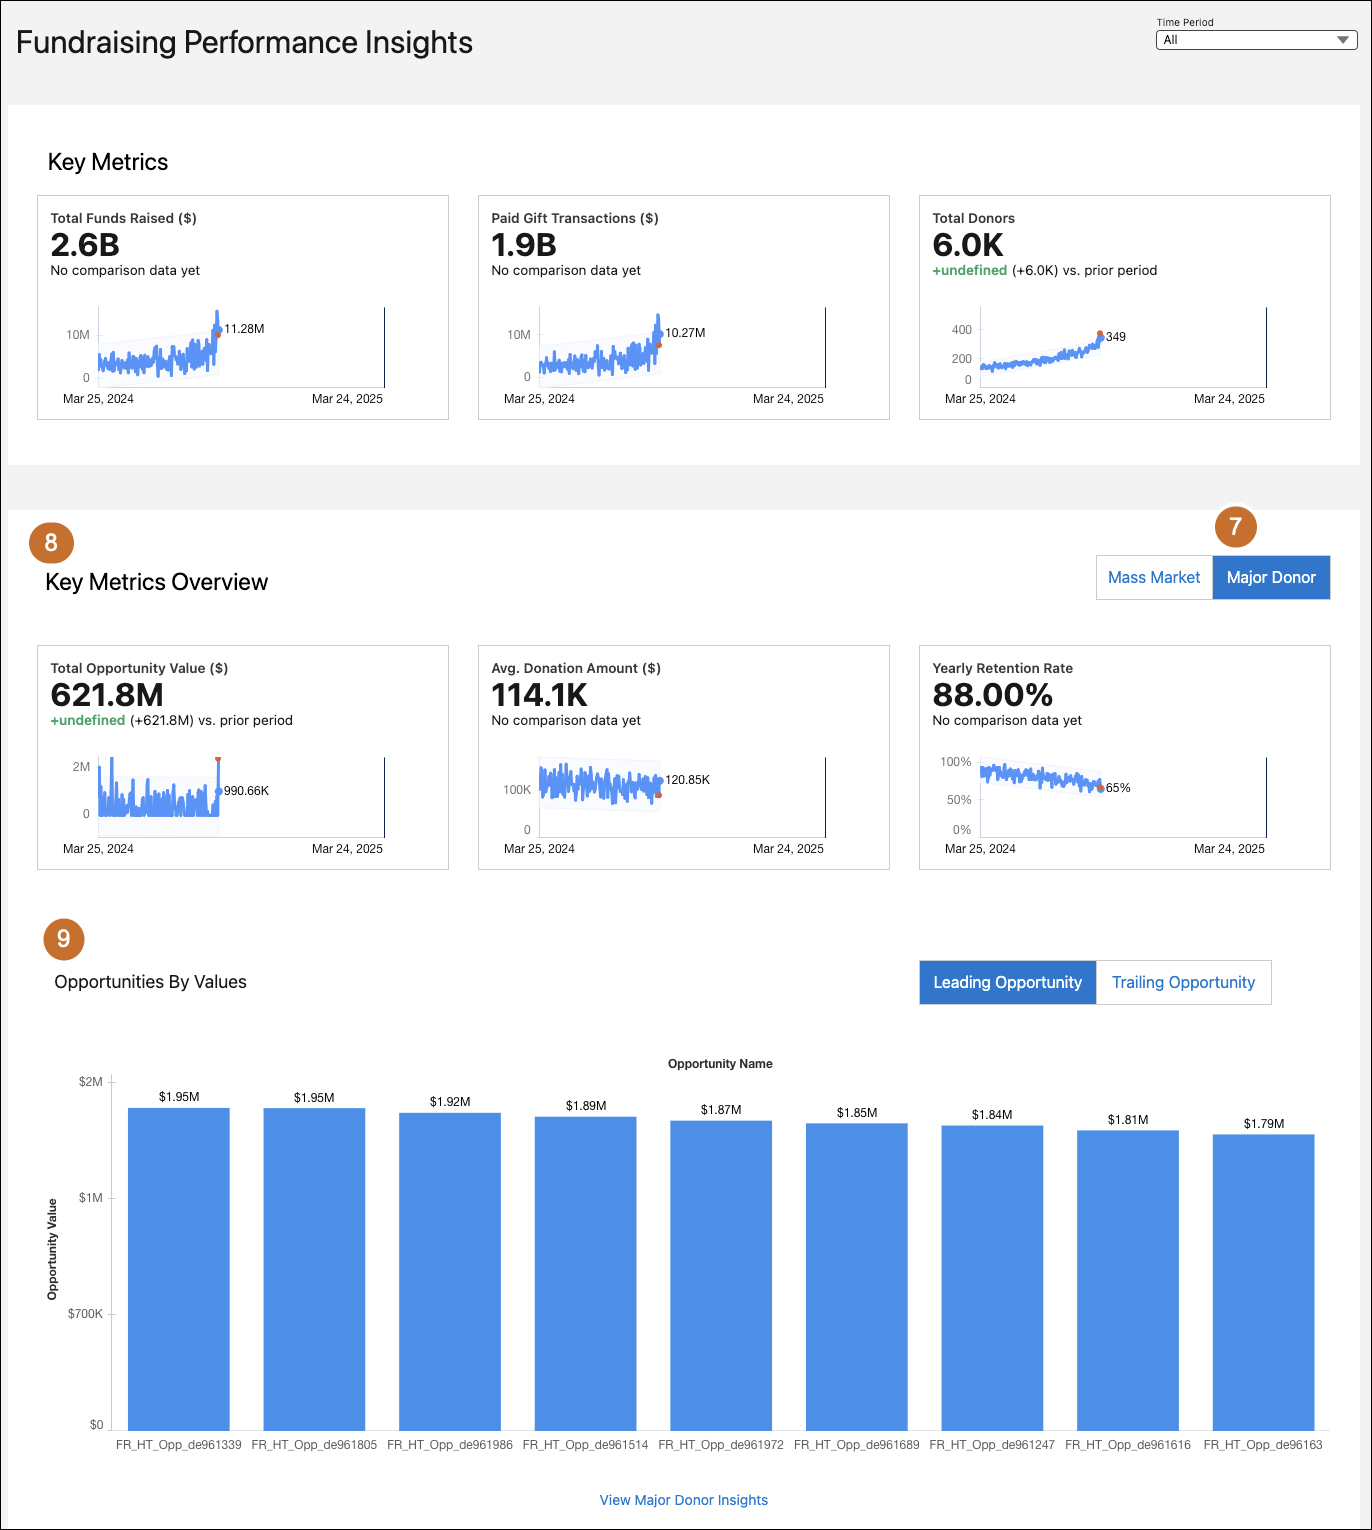
- Select Major Donor (7) to get a quick analysis of all available opportunities based on their value.
- View the performance of the key metrics (8) for the selected time period.
- Analyze the value of each opportunity (9) and identify leading and trailing opportunities based on their value.
Key Performance Indicators in Fundraising Performance Insights Dashboard
Learn the definitions and calculations of key metrics in the Fundraising Performance Insights dashboard.
| KPI | Description | Calculation | Transaction Category |
|---|---|---|---|
| Total Funds Raised | The total monetary contributions that a nonprofit organization received during a specified period, including both completed transactions and committed amounts. | "SUM GiftTransaction.""Current Amount"" + SUM GiftCommitment.""Expected Total Cmt Amount"" | All Transactions |
| Paid Gift Transactions | The total cash available from completed transactions. | SUM all GiftTransaction."Current Amount" WHERE GiftTransaction.Status = 'Paid' OR GiftTransaction.Status = 'Written-Off' | All Transactions |
| Total Donors | The number of unique donors within the selected time period. | COUNT(UNIQUE(GiftTransaction.Donor)) Filter by: (GiftTransaction.GiftCommitment IS NOT NULL AND GiftTransaction.GiftCommitment.Opportunity IS NOT NULL) GiftTransaction.Status = 'Paid' OR GiftTransaction.GiftCommitment.FormalCommitmentType = 'Is Written' |
All Transactions |
| ROI | The return on investment for a campaign, showing how much is earned compared to what’s spent. | (SUM GiftTransaction.CurrentAmount WHERE GiftTransaction.Campaign = Campaign) / Campaign.ActualCostAmount | Mass Market or Major Donor and Mass Market |
| CTRD | The cost-to-revenue ratio for each campaign. | Campaign.ActualCostAmount / (SUM GiftTransaction.CurrentAmount WHERE GiftTransaction.Campaign = Campaign) | Mass Market or Major Donor and Mass Market |
| New Recurring Donors | The number of new recurring donors added during the specified time period. | COUNT(UNIQUE(GiftCommitment.Donor)) WHERE GiftCommitment in Query2 NOT IN QUERY1 | — |
| Percentage of Recurring Donors | The percentage of donors who made recurring donations. | COUNTD([Recurring Donors])/COUNTD([Total Donors]) | Mass Market or Major Donor and Mass Market |
| All Time Recurring Donor Retention Rate | The percentage of recurring donors who made recurring donations this year. | COUNTD([IsRetentionRecurringDonor])/COUNTD([Recurring Donors]) | — |
| Donor Retention Rate | The percentage of donors who donated in the current period as well as in the previous year, compared to the total number of donors who donated in the current period. | Query 1: Total number of donors who donated last year. Query 2: Total number of donors who donated during the selected period. Donor Retention Rate: (Query 1 / Query 2) * 100 |
Major Donor or Major Donor and Mass Market |
| Median Donation Amount | The median donation amount across all donations. | "IF [Donated Amount Flag] = 'True' and ([Transaction Type] = 'Mass Market' OR [Transaction Type] = 'Mass Market & High Touch') THEN [GiftTransaction].[Current Amount] ELSE 0 END" |
Mass Market or Major Donor and Mass Market |
| Source Codes | The number of active outreach source codes used. | COUNT Outreach Source Code WHERE OutreachSourceCode."Outreach Source Code Status" = 'Active' | Mass Market or Major Donor and Mass Market |
| Total Opportunity Value | The total amounts expected from the committed opportunities. | SUM GiftCommitment.""Expected Total Cmt Amount"" WHERE GiftCommitment.Opportunity = Opportunity | — |
| Average Donation Amount | The average donation amount across selected campaigns. | Sum(GiftTransaction.CurrentAmount) / count(GiftTransaction) | Major Donor or Major Donor and Mass Market |
| Yearly Retention Rate | The percentage of donors who donated in the current period as well as in the previous year, compared to the total number of donors who donated in the current period. | Query 1: Total number of donors who donated last year. Query 2: Total number of donors who donated during the selected period. Yearly Retention Rate: (Query 1 / Query 2) *100 |
Major Donor or Major Donor and Mass Market |
| Revenue by Campaign — Leading | The chart shows the total revenue generated by each campaign, arranged in descending order, providing insights into the high performing campaigns. | Sum (Campaign Revenue) group by Campaign Name Order by Descending | Mass Market or Major Donor and Mass Market |
| Revenue by Campaign — Trailing | The chart shows the total revenue generated by each campaign, arranged in ascending order, providing insights into the low performing campaigns. | Sum (Campaign Revenue) group by Campaign Name Order by Ascending | Mass Market or Major Donor and Mass Market |
| Donors by Campaign — Leading | The chart shows the number of unique donors for each campaign, arranged in descending order, providing insights into campaigns with the highest donor participation. | Unique (Donor ID) group by Campaign Name Order by Descending | Mass Market or Major Donor and Mass Market |
| Donors by Campaign — Trailing | The chart shows the number of unique donors for each campaign, arranged in ascending order, providing insights into campaigns with the lowest donor participation. | Unique (Donor ID) group by Campaign Name Order by Ascending | Mass Market or Major Donor and Mass Market |
| ROI by Campaign — Leading | The chart shows the average return on investment (ROI) for each campaign, arranged in descending order, providing insights into the efficiency of campaigns in generating returns relative to their costs. | Avg (ROI) group by Campaign Name Order by Descending | Mass Market or Major Donor and Mass Market |
| ROI by Campaign — Trailing | The chart shows the average return on investment (ROI) for each campaign, arranged in ascending order, providing insights into the campaigns with the lowest returns. | Avg (ROI) group by Campaign Name Order by Ascending | Mass Market or Major Donor and Mass Market |
| Opportunity Value by Opportunity Name — Leading | The chart shows the value of each opportunity, arranged in descending order, highlighting the highest-value opportunities. | Sum(Opportunity Value) group by Opportunity Name order by Descending | — |
| Opportunity Value by Opportunity Name — Trailing | The chart shows the value of each opportunity, arranged in ascending order, providing insights into the opportunities with the lowest values. | Sum(Opportunity Value) group by Opportunity Name order by Ascending | — |