
You are here:
Major Donor Insights Dashboard in Nonprofit
Use the Major Donor Insights dashboard in the Philanthropy and Partnerships app to analyze donor opportunities over a specific time period. Gain data-driven insights from key fundraising metrics to easily identify high-value donors and prioritize engagement activities.
| REQUIRED EDITIONS |
|---|
| Available in: Lightning Experience |
| Available with: Nonprofit Cloud or Nonprofit Cloud for Grantmaking in Enterprise and Unlimited Editions |
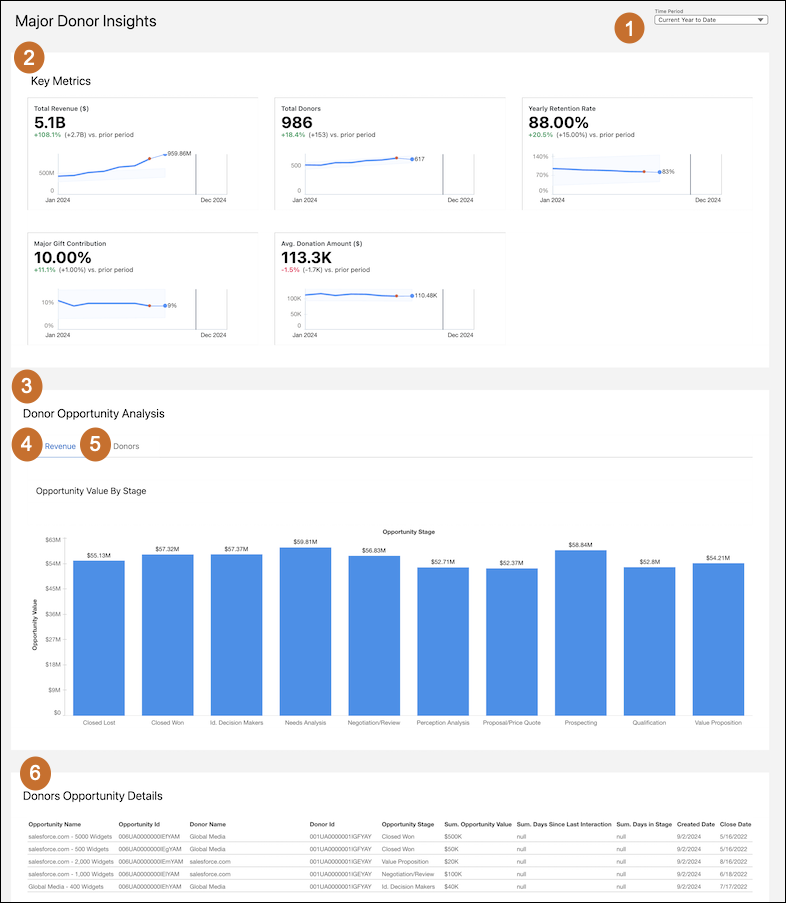
- Select the time period (1) that you want to see key metrics and analytics for.
- View the key metrics (2) for the selected period to gain insights into the effectiveness of fundraising efforts and identify donors who can make high-value contributions.
- Use the Donor Opportunity Analysis (3) section to comprehensively evaluate donor opportunities across various stages, and prioritize donor engagement.
- Select the Revenue tab (4) to view the values of opportunities in different stages and analyze them based on revenue.
- Select the Donors tab (5) to see the number of donors at each stage.
- Use the Donor Opportunity Details (6) to track which donors to reach out to, and manage high-priority opportunities by identifying follow-ups based on opportunity value, current stage, and the number of days since the last interaction.
Example Use Case: A user preparing for a fundraising campaign can use the dashboard to assess which donor segments have the highest potential, track the stages of current opportunities, and strategize outreach efforts based on average donation amounts and retention rates. By analyzing this data, the user can effectively target high-value donors and optimize their engagement strategy.
Key Performance Indicators in Major Donor Insights Dashboard
Learn the definitions and calculations of key metrics in the Major Donor Insights dashboard.
| Metric | Description | Calculation | Transaction Category |
|---|---|---|---|
| Total Revenue ($) | The total amount of all paid donations within the selected time period. | SUM(GiftTransaction.CurrentAmount) Filter by: GiftTransaction.Status = 'Paid' OR GiftTransaction.GiftCommitment.FormalCommitmentType = 'Is Written' |
Major Donor or Major Donor and Mass Market |
| Total Donors | The number of unique donors within the selected time period. | COUNT(UNIQUE(GiftTransaction.Donor)) Filter by: (GiftTransaction.GiftCommitment IS NOT NULL AND GiftTransaction.GiftCommitment.Opportunity IS NOT NULL) GiftTransaction.Status = 'Paid' OR GiftTransaction.GiftCommitment.FormalCommitmentType = 'Is Written' |
Major Donor or Major Donor and Mass Market |
| Yearly Retention Rate | The percentage of donors who donated in the current year compared to the previous year. | Query 1) select all donor where transaction.TransactionDate is >= (Compare To Time Period.EndDate - 1 Year) AND <= (Compare To Time Period.EndDate) Query 2) select all donor where transaction.TransactionDate is >= (Time Period.EndDate - 1 Year) AND <= (Time Period.EndDate) Retention Rate: query1 / query2 |
Major Donor or Major Donor and Mass Market |
| Major Gift Contribution | The number of donors associated with opportunities that are won, compared to the total number of unique donors. | Query1= UNIQUE(Opportunity.Donor) from Opportunity WHERE Opportunity.IsClosed = 'True' AND Opportunity.IsWon = 'True' Query2= COUNT(UNIQUE(GiftTransaction.Donor)) WHERE GiftTransaction.Status = 'Paid' OR GiftTransaction.GiftCommitment.FormalCommitmentType = 'Is Written'; Final result: Query1 / Query2 Filter by: GiftTransaction.Status = 'Paid' OR GiftTransaction.GiftCommitment.FormalCommitmentType = 'Is Written' |
Major Donor or Major Donor and Mass Market |
| Avg. Donation Amount ($) | The average amount per donation within the selected time period. | SUM(GiftTransaction.CurrentAmount) / COUNT(GiftTransaction) Filter by: GiftTransaction.Status = 'Paid' OR GiftTransaction.GiftCommitment.FormalCommitmentType = 'Is Written' |
Major Donor or Major Donor and Mass Market |
| Opportunity Value By Stage | The chart shows the total opportunity value aggregated by different stages in the sales pipeline. | Sum (Opportunity Value) group By Opportunity Stage | — |
| Donors by Stage | The chart shows the count of unique donors associated with each stage of the opportunity pipeline. |
Unique (Donor ID) group by Opportunity Stage | — |