
Get Your Org Status and Upcoming Maintenance Dates with My Domain
Get information about system performance and availability from trust.salesforce.com. This trust page reports status information based on your Salesforce instance. If you don’t know your instance, use your My Domain name to look it up.
Required Editions
| Available in: both Salesforce Classic and Lightning Experience |
| Available in: Group, Essentials, Professional, Enterprise, Performance, Unlimited, and Developer Editions |
-
Go to Trust Status.
The Status page shows any current incidents and provides quick access to recently viewed instances.
-
To view information for your instance, enter your My Domain name in the
search bar.
Don’t enter your complete login URL. You can get your My Domain name from the My Domain Setup page or via the subdomain for your My Domain login URL. For example, if your org’s My Domain login URL is https://example.my.salesforce.com, enter example.
 Tip If you don’t want to use your My Domain name, you can find your instance on the Company Information Setup page. From Setup, in the Quick Find box, enter Company Information, and then select Company Information. The Instance field contains your Salesforce instance.
 -
Under My Domains, select your instance.
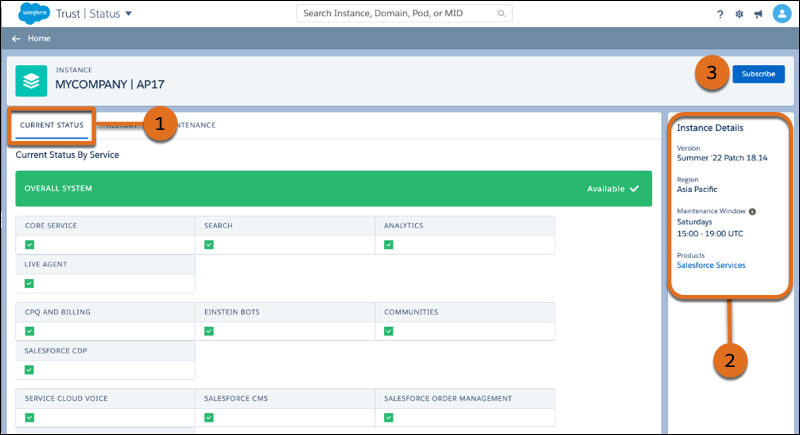
The Current Status (1) displays by default. In the Instance Details section (2), you can find your current version, region, and maintenance window. To subscribe to updates, click Subscribe (3). For more information on subscriptions, see the Trust Status Notification Guide.
Here are the possible color indicators for your status.
- Green (Available): This instance is available and fully functional.
- Blue (Informational): Used to display information about the instance that’s unrelated to a performance issue or service disruption.
- Purple (Maintenance): This instance is in maintenance. An informational message indicates your ability to access the instance during the maintenance.
- Yellow (Service Degradation): The instance is accessible, but some functionality is unavailable or the service is running with significant latency. To get more information, click the incident number.
- Red (Service Disruption): The instance is inaccessible to customers. To get more information, click the incident number.
-
To get a historical view of your status, click
History.
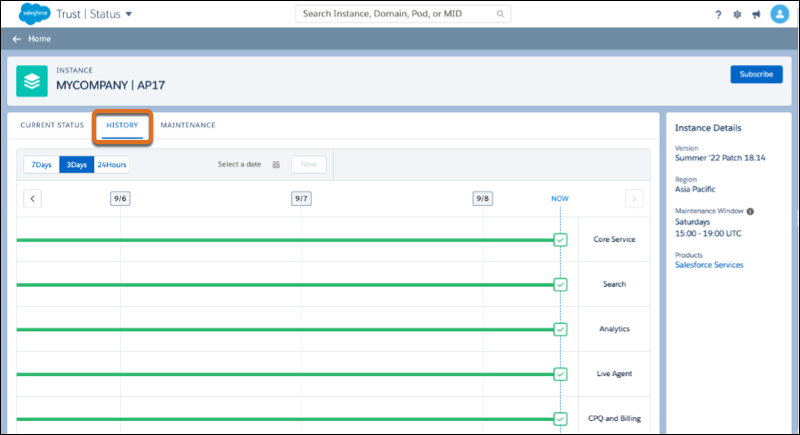
Optionally, you can select a range and enter a date around which to center the range. For example, to view your history from August 29, 2022 to September 4, 2022, select 7Days, and then select September 1, 2022 as the date.
-
To view maintenance events, click
Maintenance.
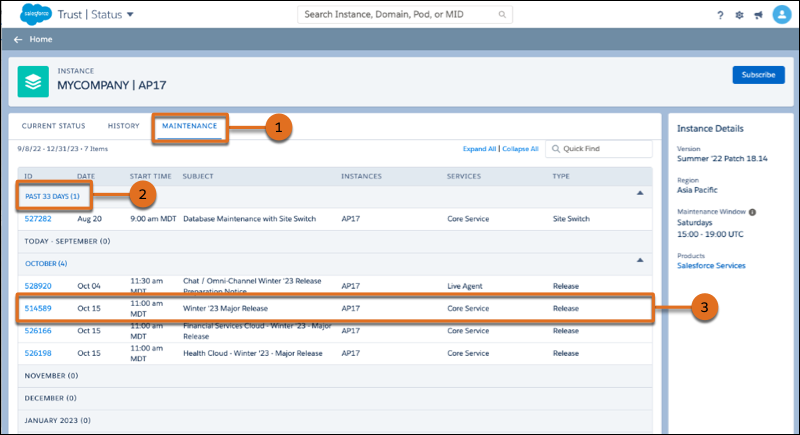
After you click Maintenance (1), you can view 12 months of future maintenance events. If maintenance events occurred within the past 33 days, a link with a count is available at the top of the list (2). To display those events in the table, click PAST 33 DAYS (#). In this example, AP17 is scheduled to get the Winter ’23 Major Release on October 15 (3). For more details on a maintenance event, click the ID number.
 Note The Instance Details section includes your standard maintenance window in the UTC time zone. The date and time for maintenance events are in the user’s time zone, as detected by the browser.