
You are here:
Track Your Sales Performance
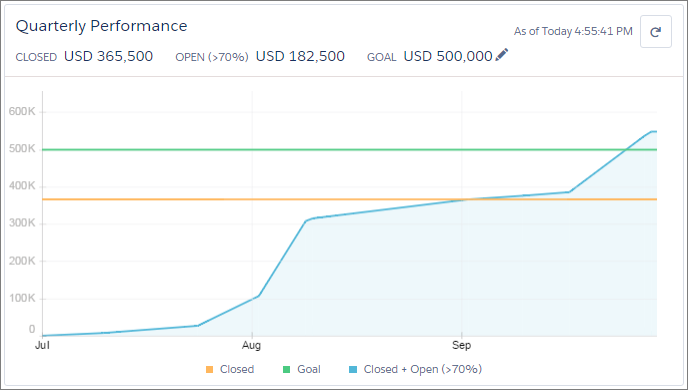
Track your sales performance or the performance of your sales team against a customizable sales goal with the performance chart on the Home page in Lightning Experience.
Required Editions
| Available in: Lightning Experience |
| Available in: Professional, Enterprise, Performance, Unlimited, and Developer Editions |
The performance chart displays data based on your sales team’s opportunities if you have an associated team. Otherwise, the chart displays opportunities you own. Only opportunities for the current sales quarter that are closed or open with a probability over 70% are displayed.
- Closed—The sum of your closed opportunities.
- Open (>70%)—The sum of your open opportunities with a probability over 70%. The blue line in the chart is the combined total of the closed opportunities and open opportunities with a probability over 70%.
- Goal—Your customizable sales goal for the quarter. This field is specific to the
performance chart and has no impact on forecast quotas or any other type of goal. To set the
goal, click
 .
.
The chart aggregates data from all qualified opportunities. For example, the amount shown represents the aggregate amount from all qualified opportunities.
To see the closed and committed opportunity amounts for different dates, hover over the chart. If you hover over a date when an opportunity was closed or set to a probability over 70%, a blue dot appears. Clicking the dot opens a window that shows the details about the opportunities for that date.
The performance chart isn’t refreshed automatically. To make sure you have the most up-to-date
view of your sales performance, click ![]() .
.