
You are here:
Performance Insights
The Performance Insights dashboard focuses on four core metrics for page performance, which are measured and presented in different ways to provide useful insights. These four metrics are presented at the top of your report.
| Metric | Details |
|---|---|
| First Page Experienced Page Time (EPT) | Page load time for a complete page load, including Lightning Experience bootstrap (framework initialization), measured in milliseconds. (Divide by 1000 to get the number of seconds.) Typically, Lightning Experience bootstrap is required only for the first page a user visits in Lightning Experience. You can’t affect the time it takes for Lightning Experience bootstrap — that’s our job, and we’re always working on it! Since it adds significant time to the EPT, we measure and share it, but it’s the next metric that represents the more typical user experience. |
| Subsequent Page EPT | Page load time for additional pages, after Lightning Experience bootstrap, measured in milliseconds. Typically, this is any page a user navigates to after loading Lightning Experience. Without the need to reload Lightning Experience, this metric is typically faster. While First Page EPT represents a first impression or start of session experience, Subsequent Page EPT is the better measurement of how your users experience Salesforce as they use it throughout a working session. |
| Total Page Views | Total number of page views over the seven day period. You can use it as a way to track increasing usage of your Salesforce implementation. |
| First Page Views, % of Total | Proportion of all page views that are first page views. This ratio gives you a meaningful insight into how your users experience working with Salesforce in Lightning Experience. This number should normally be low, a minority of overall page views. If it isn’t, that might indicate you need to spend some time thinking about the business processes that are performed in Salesforce, and optimize navigation or otherwise make it easier for your users to stay in Lightning Experience. |
Key Insights
This section provides a plain-language summary of the most important performance takeaways. Rather than just presenting raw numbers, this section interprets the data for you, highlighting critical issues and applicable best practices. It serves as your starting point, immediately drawing your attention to the most significant performance problems and opportunities for your org.
| Insight | Details |
|---|---|
| Number of components | The number of custom components on a page affects page load time, especially when a component is complex or inefficient. Make sure every component on your pages has a purpose. |
| Secured Browser Caching | Secure data caching in the browser improves page reload performance by avoiding extra round trips to the server. This setting is enabled by default. |
| Lightning CDN | The Lightning content delivery network (CDN) serves static content for the Lightning component framework. This setting is enabled by default. |
| Dynamic Boxcar'ing | Dynamic boxcar optimization improves Aura application performance by grouping Aura actions into boxcars. |
| Apex caching | Percentage of Apex actions that are served from client cache, instead of requiring a round-trip to the server. Make sure your Apex classes are taking full advantage of the @AuraEnabled annotation to allow caching of server-side action results. |
| Slowest Apex actions | These Apex methods are the slowest actions used by your custom components. Check ApexGuru Insights for opportunities to optimize these actions. |
Performance Trends
Below Key Insights, you’ll find charts that visualize your org’s P75 EPT over the selected week, as well as breaking EPT down by region and browser. This graph helps you identify trends and understand performance patterns. You can see when EPT is spiking, whether performance is degrading over time, or if recent changes have improved page load times.
The Performance Trends chart shows trends for both the initial page load (1st Page EPT) and subsequent page navigations within the application.
High Impact, Slow Performing Pages
This section lists the ten pages with the highest combination of the number of page views and the highest P75 EPT – in other words, the ten slow pages that are used the most. With this data, you can focus your optimization efforts where they will have the most impact.
This section goes deeper by identifying the specific pages, components, and actions that might make Salesforce feel slow for your users. For a given page in the table, you can expand the row to see the individual components and their actions — such as complex Apex calls or inefficient component logic — that are the most resource-intensive. This lets you and your development team move directly from analysis to action, addressing the root cause of the performance bottleneck at a very fine grained level.
Untimed Action Metrics
The following non-time-based metrics are provided. These metrics offer insight into which component actions are executed the most frequently, and whether and how efficiently they’re reused.
| Metric | Details |
|---|---|
| Action Count | The number of times this action was executed during the selected time period. |
| Boxcar Count | The number of actions that were batched together in a single network request. Lightning Experience can group multiple actions into one request for efficiency. Higher counts mean more efficient batching, but potentially longer individual action times if the batch becomes too large. See Batching of Server-side Actions in the Lightning Aura Components Developer Guide for a detailed description of the boxcar’ing process. |
| Cache Eligible | Indicates if an action can be served from a cache. If it can, it loads faster because it doesn’t require new processing from the server. Check the cache hit ratio to see how often this actually happens. See Client-Side Caching of Apex Method Results in the Lightning Web Components Developer Guide and Storable Actions in the Lightning Aura Components Developer Guide for additional details. |
| Cache Hit Ratio | The percentage of actions that returned results from cache rather than requiring server processing. Higher ratios indicate better caching efficiency, and generally result in faster response times for repeated actions. |
Timed Action Metrics
Interpreting the details provided in the High Impact, Slow Performing Pages list is easier when you understand how actions are processed, from the time a component fires the action, to the different phases of the round-trip to Salesforce, until the action completes and any updates are applied to the page.
The following diagram illustrates the various phases of an action request.
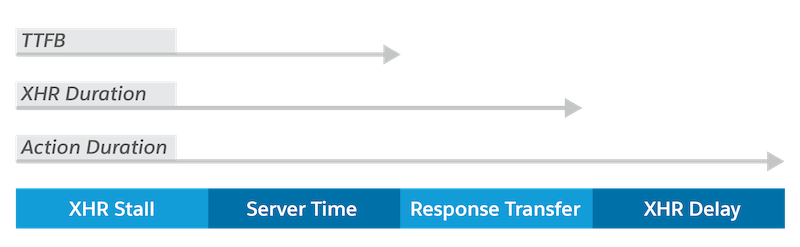
The Performance Insights dashboard provides the following time-based metrics
| Metric | Details |
|---|---|
| XHR Request Stall Time | Measure of the initial network connection delay before a request is sent to the server. This includes the time needed to look up the server’s address (DNS lookup) and establish the network connection (TCP setup). |
| Server Time | Time spent executing the action on the server, including database operations and business logic. This excludes network transfer time and client-side processing, and can help identify when delays are due to server processing. |
| Time to First Byte (TTFB) | Time from when a request is sent to the server until the first byte of the response is received. This indicates how quickly the server responds to the action, and can help identify when delays are due to server processing or network issues. |
| XHR Duration | Time between when a network request is sent to the server and when the full response is received by the client. This measures pure network communication time, including the server execution time, but not client-side processing. |
| XHR Response Stall Time | Delay in processing the response, between when a network response is received from the server and when the JavaScript callback can execute due to the main thread being busy. This metric helps identify when the client-side application is the bottleneck, rather than network or server performance issues. Client-side processing issues that prevent immediate response handling are often caused by heavy JavaScript execution or UI thread blocking. High values can indicate that the action or component should be reviewed, and possibly redesigned to handle responses more independently or asynchronously. |
| Duration | Total time for this action to complete, from when the action is first requested until the client-side callback completes. This includes all waiting time, network transfer, server processing, and client-side execution. It’s the complete end-to-end time for an action to finish. |
Usage Insights (Beta)
Usage Insights (beta) identifies your most popular pages and evaluates their performance. This dashboard lets you pinpoint performance bottlenecks and focus on optimizing your most used pages.
Average Page Views
The average number of page views over the chosen 7-day period.
Total Page Views
The total number of page views over the chosen 7-day period.
Average Daily Active Users (DAU)
The average DAU over the chosen 7-day period. DAU is the count of unique users who visited your site.
High-Level Page View and Daily Active Users (DAU) Metrics
In the Usage Insights (beta) tab, you'll find metrics that monitor the scale of your org's activity, including average page view, total page view, and average DAU data for a 7-day period. This data offers insights into your org's overall reach and user base.
Page Views Trends and DAU Trends
Using trend charts for page views and DAU, you can visualize how usage patterns shift over time. Both charts track first and subsequent data points in separate trendlines.
Identify the Most Used Pages
The Most Used Pages table highlight which of your pages pages receive the most user traffic. This lets you focus optimization efforts where they have the greatest impact on user experience. You can use EPT data in this table to evaluate in your most popular pages meet performance expectations.