You are here:
Use the IDX Workbench Process Profiler (Managed Package)
For the managed package runtime, the Process Profiler lets you view the Tracking Service data for an object in a source or target org.
Before you can view this data, you must enable the Tracking Service and run through your business flow to capture this tracking data. See
 This information is for Omnistudio for Managed Packages. For Omnistudio on standard runtime, see Omnistudio Help.
Tracking Service in Omnistudio for Managed Packages (Managed Package).
-
Click the List Panel icon (
 ).
).
- Click Process Profiler.
-
Select an orgfrom the dropdown list. Orgs configured in any project are listed, or
you can configure a new environment.
Performance data is downloaded immediately. For large orgs, downloading can take some time.
- Select a component type from the dropdown list, either Omniscript or Integration Procedure. The list contains component types that have tracking data.
- Select a component from the dropdown list. The list contains components that have tracking data.
- (Optional) To filter the data by date, enter a start date and/or an end date.
- (Optional) To limit the number of invocations to be averaged, type an integer in Last N Executions.
- (Optional) To filter the data by component users, click the User list and select the desired user names.
-
(Optional) To go to a step in the org, right-click the step name, then click
Open in Browser.
For example, right-click an Omnistudio Data Mapper Extract Action to open the Data Mapper that the step calls.
-
If new performance data has been generated in the org, click Refresh
Data to download it.
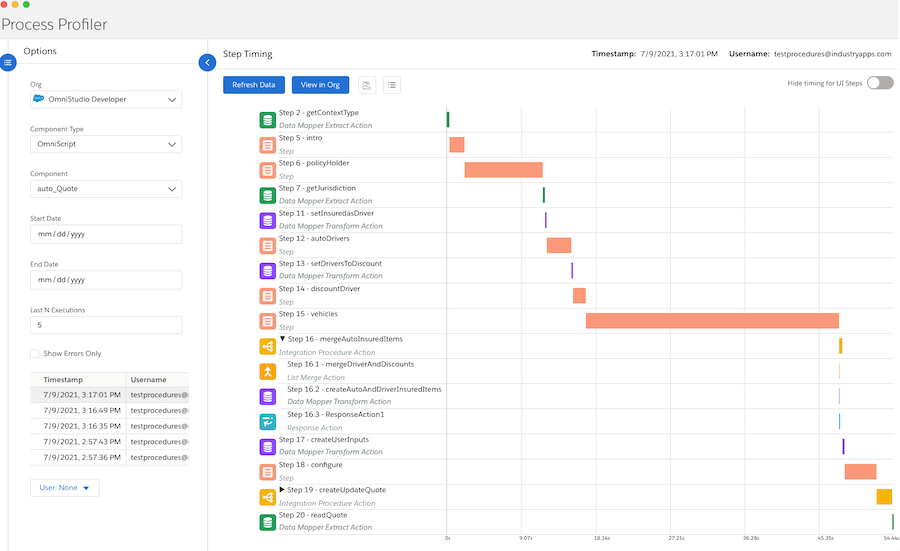
For example, when you retrieve Omniscript data, the Process Profiler looks something like this: