You are here:
Flatten Transformation: Flatten Hierarchies
In Salesforce Data Pipelines, the Flatten transformation flattens hierarchical data. For example, you can flatten the Salesforce role hierarchy to implement row-level security on a dataset based on the role hierarchy.
Required Editions
Flatten Transformation: Flatten Hierarchies
| User Permissions Needed | |
|---|---|
| To create a recipe: | Edit Analytics Dataflows OR Edit Dataset Recipes |
When you configure the Flatten transformation, you specify the field that contains every node in the hierarchy and the field that contains their corresponding parent based on the hierarchy. The Flatten transformation generates one record for each hierarchy node, which we refer to as the record ID (also known as the child node). After you run the recipe, each record contains two generated columns that store the hierarchy for each record ID. One column contains a list of all ancestors for each node in the hierarchy. The other column contains the hierarchy path.
Consider the number of levels you’re flattening with the row size of your dataset. The Flatten transformation can flatten:
- Up to 300 levels with a < 1million-row dataset.
- Up to 100 levels with a 15 million-row dataset.
- Up to 50 levels with a 20 million-row dataset.
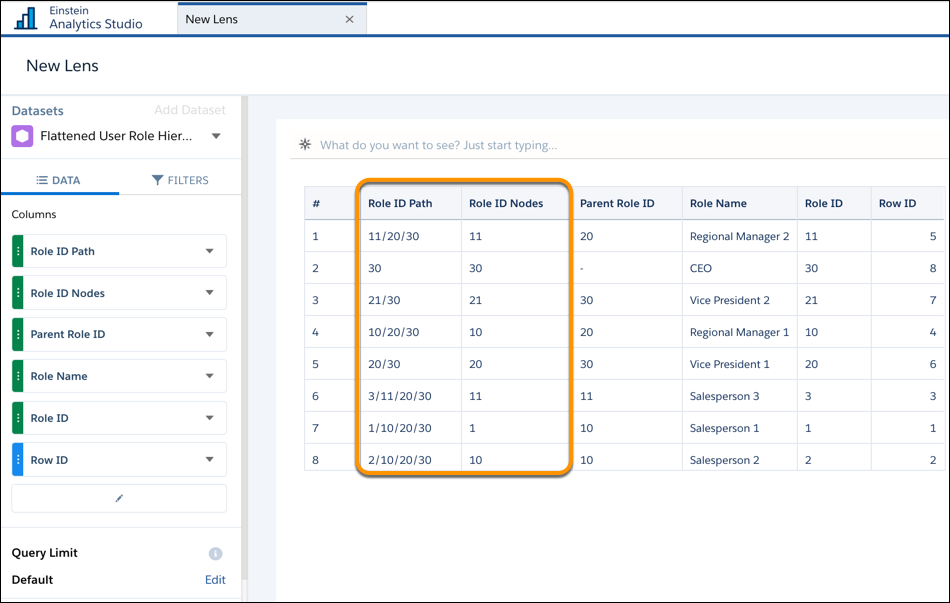
See the Roles and Role Path columns in the following flattened dataset to see how ancestors are stored.
| Record ID (child node) | Role Name | Parent Record ID | Roles | Role Path |
|---|---|---|---|---|
| 1 | Salesperson 1 | 10 | 10, 20, 30 | /10/20/30 |
| 2 | Salesperson 2 | 10 | 10, 20, 30 | /10/20/30 |
| 3 | Salesperson 3 | 11 | 11, 20, 30 | /11/20/30 |
| 10 | Regional Manager 1 | 20 | 20, 30 | /20/30 |
| 11 | Regional Manager 2 | 20 | 20, 30 | /20/30 |
| 20 | Vice President 1 | 30 | 30 | /30 |
| 21 | Vice President 2 | 30 | 30 | /30 |
| 30 | CEO | Not applicable | Not applicable | Not applicable |
You can also configure the Flatten transformation to include the record ID in the generated hierarchy columns. The following dataset shows the record ID in bold.
| Record ID (child node) | Role Name | Parent Record ID | Roles | Role Path |
|---|---|---|---|---|
| 1 | Salesperson 1 | 10 | 1, 10, 20, 30 | /1/10/20/30 |
| 2 | Salesperson 2 | 10 | 2, 10, 20, 30 | /2/10/20/30 |
| 3 | Salesperson 3 | 11 | 3, 11, 20, 30 | /3/11/20/30 |
| 10 | Regional Manager 1 | 20 | 10, 20, 30 | /10/20/30 |
| 11 | Regional Manager 2 | 20 | 11, 20, 30 | /11/20/30 |
| 20 | Vice President 1 | 30 | 20, 30 | /20/30 |
| 21 | Vice President 2 | 30 | 21, 30 | /21/30 |
| 30 | CEO | Not applicable | 30 | 30 |
If a hierarchy is incomplete or contains a circular relationship, the Role and Role Path values aren’t calculated. For example:
- If Regional Manager 1 isn’t present in the dataset, a flattened hierarchy isn’t generated for Salesperson 1 and Salesperson 2.
- If Salesperson 1 reports to Regional Manager 1, who reports to Vice President 1, who reports to Salesperson 1, a flattened hierarchy isn’t generated for these roles.
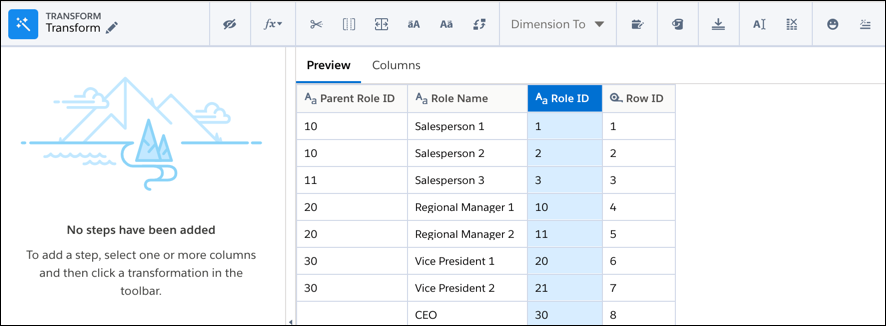
To create a flatten transformation:
- In a Transform node of a Data Prep recipe, select the text (dimension) column that
contains all the record IDs (or child nodes) in the hierarchy. The record ID column can’t
contain null values.
- In the Transform toolbar, click the Flatten button (
 ).
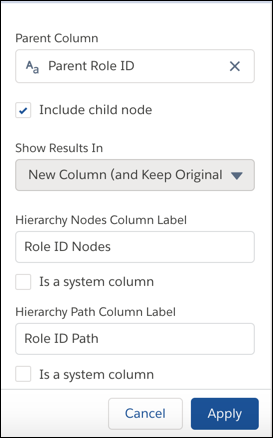
). - Enter the following transformation details.
Property Description Record ID Column Column that identifies each record. Also known as the child node. Parent ID Column Column that contains the parent of each node in the hierarchy. For example, the Regional Manager 1 role is the parent of the Salesperson 1 role in a role hierarchy. Include Record ID Column Value Indicates whether to include the record ID column value in the generated hierarchy nodes and path columns. Hierarchy Nodes Column Label Name of the multivalue output column that contains a list of all ancestors in the hierarchy, in order from the lowest to the highest level. The Flatten transformation creates this column and generates the list of ancestors for each node in the hierarchy. For example, for Salesperson 1 role, the hierarchy of ancestors is:
Sales Manager 1, Regional Manager 1,Vice President 1, CEO. To hide this column from queries and dataset exploration, select Is a system column. By default, this column isn’t created as a system column.
Hierarchy Path Column Label String that contains the hierarchical path of all ancestors in the hierarchy, in order from the lowest to the highest level. Nodes are separated by forward slashes. The Flatten transformation creates this output column and generates the ancestry path for each node in the hierarchy. For example, for a salesperson role in a role hierarchy, the value is:
Sales Manager 1/Regional Manager 1/Vice President 1/CEO. To hide this column from queries and dataset exploration, select Is a system column. By default, this column isn’t created as a system column.
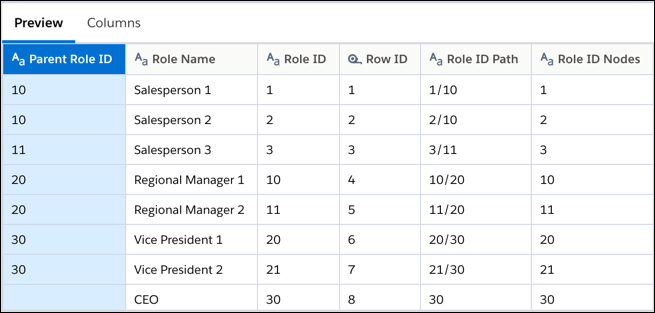
- Preview the transformation results to check that the flattened hierarchy is
right.
Preview shows only the record ID and its parent in the hierarchy nodes column and only the record ID in the hierarchy path column. You have to run the recipe to see all ancestors in both columns.
- Click Apply to add the transformation to the Transform node.
- To collapse the view and see the Graph area, click the Collapse button (
 ).
).
Run the recipe to generate the hierarchy nodes and hierarchy path columns in the dataset. Only the first value in the hierarchy nodes column appears when exploring the dataset in a lens. In general, a lens shows only the first value of a multivalue column.