You are here:
Consumption Analytics Consumption Overview
The Consumption Analytics dashboard’s Consumption Overview tab contains a metric and visualizations that give you a high-level overview of what’s driving consumption, including total credits consumed, daily credits consumed by consumption card, sources and usage types that use the most consumption, as well as a consumption forecast by consumption card.
Each viz description includes a table that indicates the standard consumption tags and calculated fields used to build the visualization. The Consumption Insights Semantic Model (SDM) leverages the fields (standard tags) in the Consumption Insights data model object (DMO). The fields in this DMO are the same as the ones in the TenantEnrichedUsageEvent DLO. See TenantEnrichedUsageEvent Data Lake Object for a description of each standard tag.
The dashboard displays usage for the org that holds the entitlements, as indicated by the Entitlement Org ID filter for each visualization.
Total Consumption Over Time
The Total Consumption Over Time report shows a graph of total number of credits consumed for all consumption cards over a specific time range, by default, All time. You can use the Card Name, Usage Type, and Environment Type filters to narrow the results. We also remove usage types that use the MAX aggregation type, such as Data Storage Allocation and Data Cloud Real-Time Profiles.
To learn more about metrics insights, see Salesforce Help:
Daily Consumption by Consumption Card
The Daily Consumption by Consumption Card report provides a vertical bar chart that shows daily number of credits consumed for all consumption cards.
| Option | Consumption Tags and Calculated Fields |
|---|---|
| Filters | Usage Type Developer Name (all usage types except Data Cloud Storage or Data Cloud Real-time Profile), Entitlement Org ID |
| Marks (group by) | Card Name |
| Columns (x-axis) | Consumption by Date (calculated field) |
| Rows (y-axis) | SUM (Units Consumed) |
Top 10 Sources with Consumption
The Top 10 Sources with Consumption report shows the top 10 tagged sources or features that consumed the most credits. A source can be, for example, any agent action, prompt, Data Cloud resource, and so on.
| Option | Consumption Tags and Calculated Fields |
|---|---|
| Filters | Resource ID Or Api Name, Entitlement Org ID, Usage Type Developer Name (all usage types except Data Cloud Storage or Data Cloud Real-time Profile) |
| Marks (group by) | Resource ID Or Api Name |
| Columns (x-axis) | SUM (Units Consumed) |
| Rows (y-axis) | Resource ID Or Api Name |
Top 10 Usage Types with Consumption
The Top 10 Usage Types with Consumption report show the top 10 usage types that consumed the most credits across consumption cards.
| Option | Consumption Tags and Calculated Fields |
|---|---|
| Filters | Entitlement Org ID, Usage Type Developer Name (all usage types except Data Cloud Storage or Data Cloud Real-time Profile) |
| Marks (group by) | Usage Type Developer Name |
| Columns (x-axis) | SUM (Units Consumed) |
| Rows (y-axis) | Usage Type Developer Name |
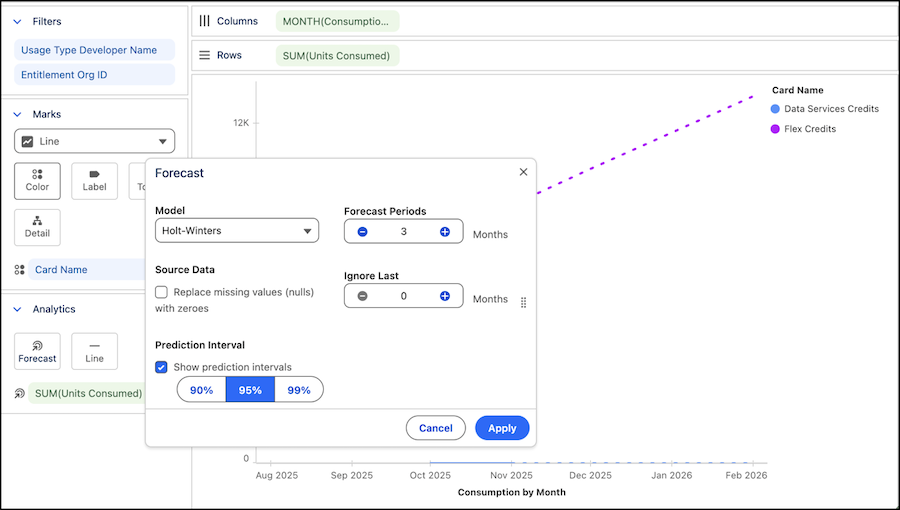
Consumption Forecast
The Digital Wallet Consumption Forecast report shows a forecasted trend for consumption by month for each consumption card. With this report, you can see forward-looking consumption data so you can plan and budget your Salesforce products’ credit spend, for example, for Data 360 credits and Agentforce Flex Credits. The forecast period extends 3 months into the future.
If a forecast report indicates “we couldn’t display this content," it’s likely due to insufficient historical data. Generally, you need at least 3 data points in the time series to estimate a trend.
| Option | Consumption Tags and Calculated Fields |
|---|---|
| Filters | Usage Type Developer Name (all usage types except Data Cloud Storage or Data Cloud Real-time Profile), Entitlement Org ID |
| Marks (group by) | Card Name |
| Analytics | SUM (Units Consumed) |
| Columns (x-axis) | MONTH (Consumption by Date) |
| Rows (y-axis) | SUM (Units Consumed) |
This forecast was configured using the Holt-Winters model with a forecast period of 3 months.